Difference between revisions of "IS428 AY2019-20T1 Assign Wei Ming InteractiveVisualization"
Jump to navigation
Jump to search
| Line 26: | Line 26: | ||
'''Check full visualization''' [https://public.tableau.com/profile/wei.ming3265#!/vizhome/WEI_MING_IS428_ASSIGNMENT/Home here] | '''Check full visualization''' [https://public.tableau.com/profile/wei.ming3265#!/vizhome/WEI_MING_IS428_ASSIGNMENT/Home here] | ||
| + | = Overview = | ||
| + | [[File:Home Navigator.png|thumb|center|800px|Figure1 Homepage Navigator]] | ||
| + | == Part 1: Preliminary Analysis == | ||
| + | |||
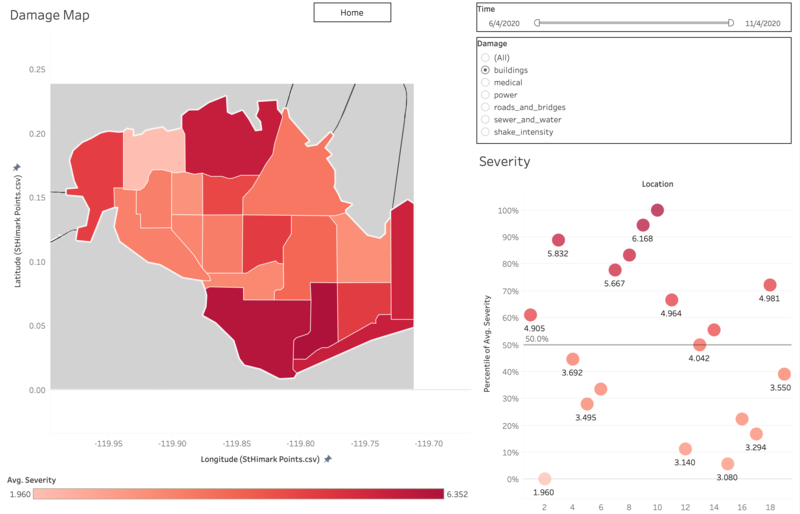
| + | == Part 2: Damage Map == | ||
| + | [[File:Damage map.png|thumb|center|800px|Figure2 Damage Map Dashboard]] | ||
| + | == Part 3: Change Over Time == | ||
| + | [[File:Location selector.png|thumb|center|800px|Figure3 Location Selector]] | ||
| + | [[File:Calendar heatmap wm.png|thumb|center|800px|Figure4 Calendar Heatmap]] | ||
| + | [[File:Time series wm.png|thumb|center|800px|Figure5 Time Series Severity and Variance]] | ||
| + | [[File:Cycle plot wm.png|thumb|center|800px|Figure6 Cycle Plot Graph]] | ||
Revision as of 21:43, 13 October 2019
Check full visualization here


