Difference between revisions of "IS428 AY2019-20T1 Assign Foo Yong Long RiskAnalysis"
Ylfoo.2017 (talk | contribs) |
Ylfoo.2017 (talk | contribs) (/* Which regions of the city have greater uncertainty of radiation measurement? Use visual analytics to explain your rationale. What effects do you see in the sensor readings after the earthquake and other major events? What effect do these events have...) |
||
| Line 68: | Line 68: | ||
<p> | <p> | ||
<div style="background: #364558; padding: 15px; font-weight: bold; line-height: 0.3em; text-indent: 0px;font-size:20px"><font face="Arial" color=#fbfcfd><center>'''Missing Data'''</center></font></div> | <div style="background: #364558; padding: 15px; font-weight: bold; line-height: 0.3em; text-indent: 0px;font-size:20px"><font face="Arial" color=#fbfcfd><center>'''Missing Data'''</center></font></div> | ||
| + | |||
| + | {| class="wikitable" style="background-color:#FFFFFF;" width="100%" | ||
| + | |- | ||
| + | ! style="font-weight: bold;background: #536a87;color:#fbfcfd;width: 10%;" | Step | ||
| + | ! style="font-weight: bold;background: #536a87;color:#fbfcfd;width: 90%;" | Description | ||
| + | |- | ||
| + | | | ||
| + | 1 | ||
| + | || | ||
| + | [[File:MissingMobile.png|900px|center]] | ||
| + | '''Mobile''' | ||
| + | [[File:MissingStatic.png|900px|center]] | ||
| + | '''Static''' | ||
| + | |||
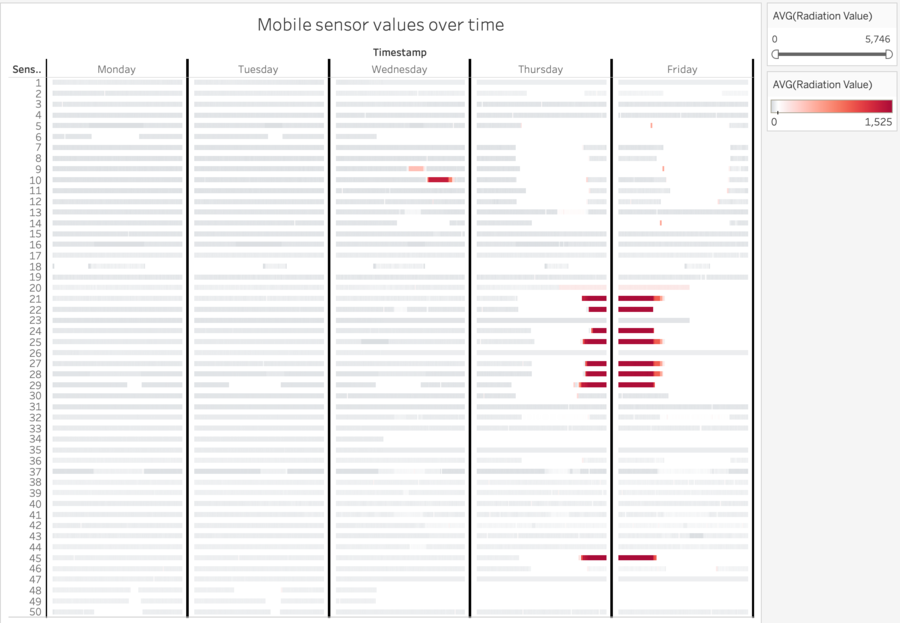
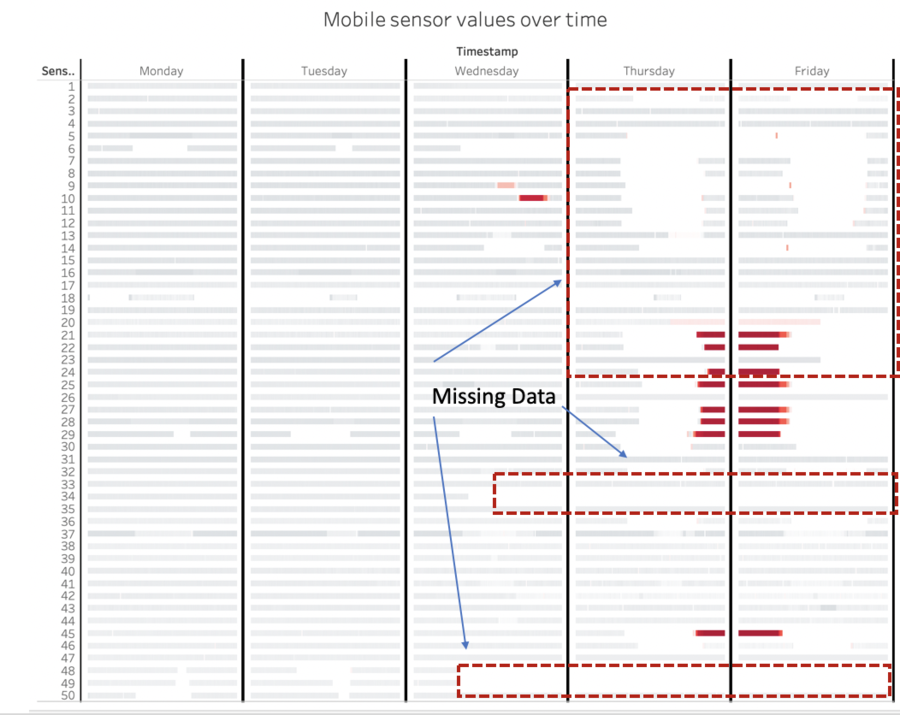
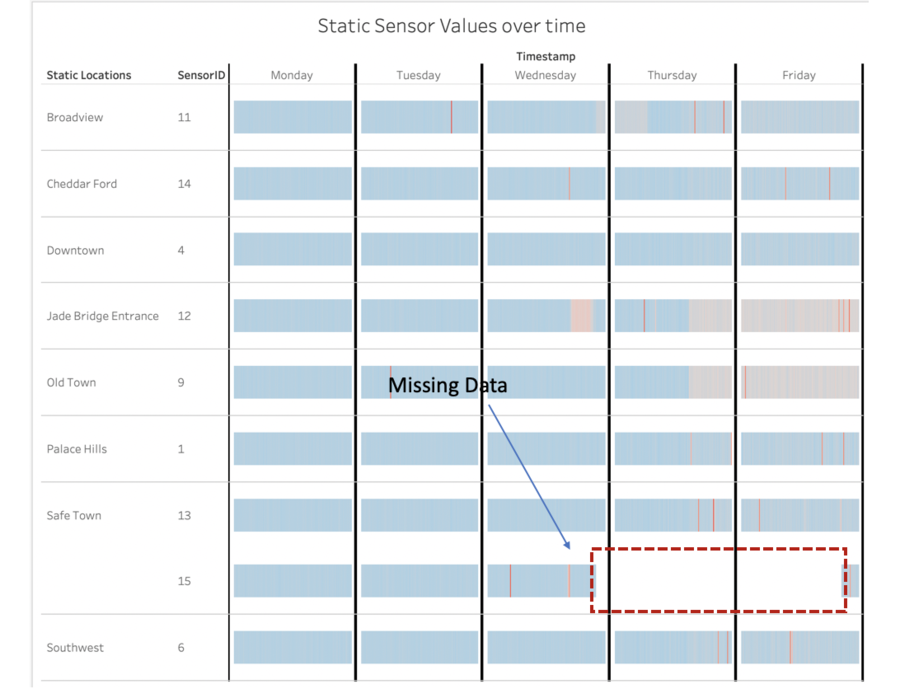
| + | There were missing data for both the Static and Mobile Sensors. | ||
| + | |||
| + | |- | ||
| + | | | ||
| + | 2 | ||
| + | || | ||
| + | |||
| + | [[File:EarthQuake.png|900px|center]] | ||
| + | [[File:Sensor9Pickup.png|900px|center]] | ||
| + | [[File:Sensor10Pickup.png|900px|center]] | ||
| + | |||
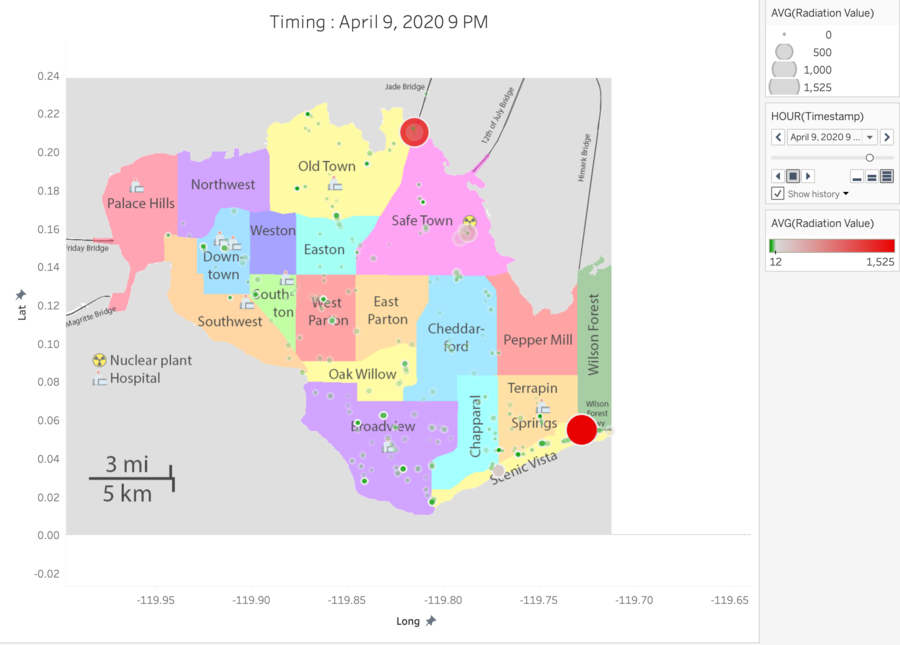
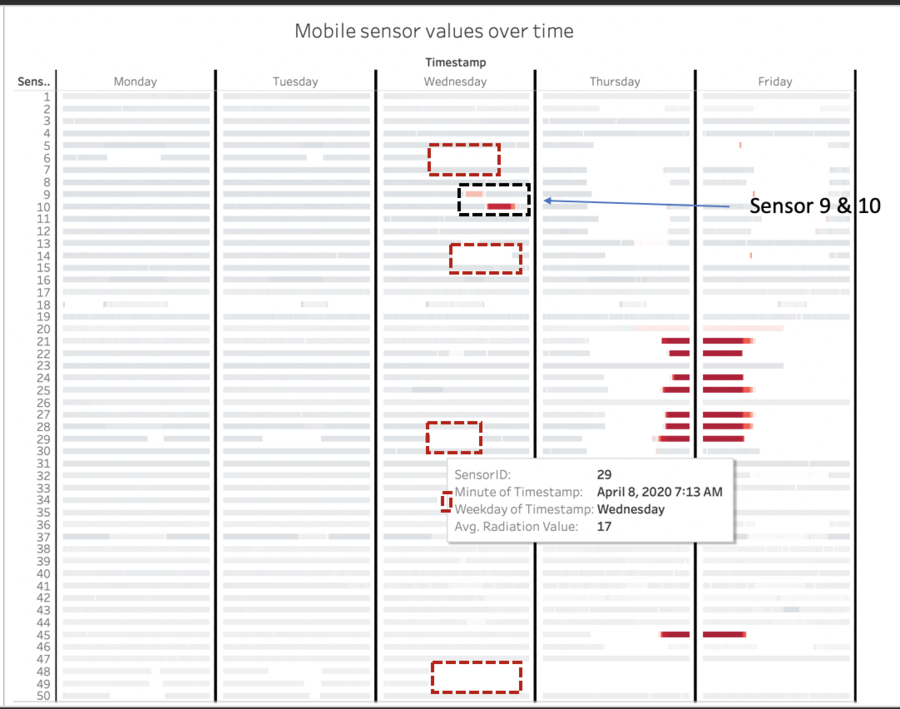
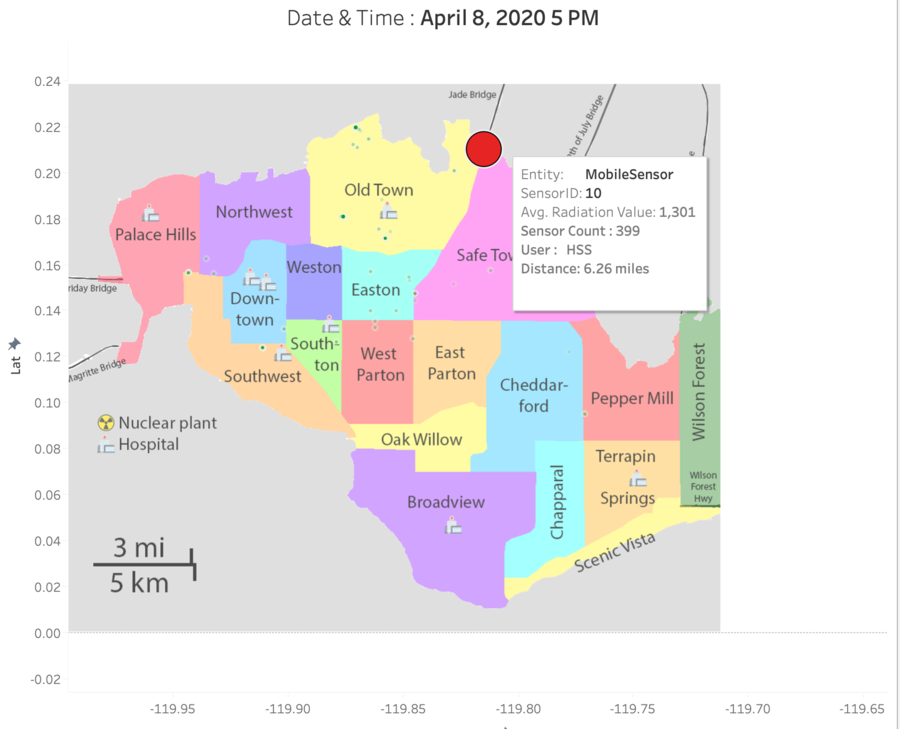
| + | The earthquake might have happened around 7.10am on 8th April. A bunch of mobile sensors lost connectivity on the morning of 8th April around 7.16 am - 7.30 am. This might have caused a radiation leak at the nuclear plant. Shortly afterward from 1.26 pm to 4.27 pm, Mobile Sensor 9 which is driving beside the nuclear plant (Distance from plant = 0.62 miles), detected an increase in radiation level to 1301. At 5 pm, there was a surge in radiation levels at the entrance of the Jade bridge (Distance from plant = 6.26 miles). | ||
| + | |||
| + | Subsequently, there is an increase in radiation levels among radiation levels from 8th April onwards and more sensors stopped functioning. | ||
| + | |||
| + | |- | ||
| + | |||
| + | | | ||
| + | 3 | ||
| + | || | ||
| + | [[File:StaticUncertainity.png|900px|center]] | ||
| + | |||
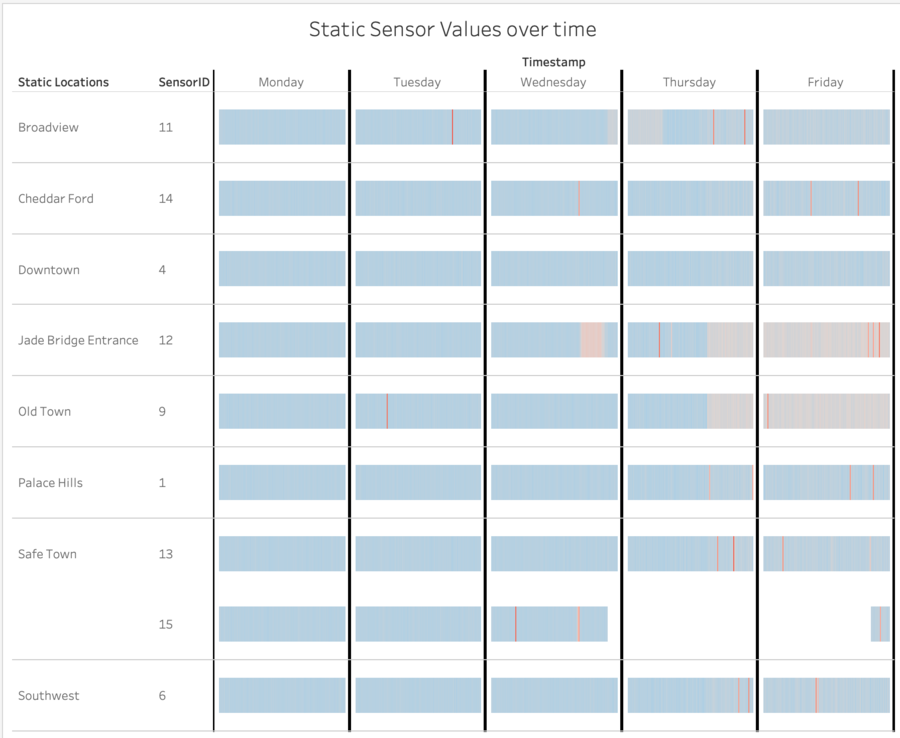
| + | The variation of static sensors is minimal as compared to the moving sensors. These shows uncertainty as they have minimal coverage being stationary. Furthermore, only 8 towns were covered out of the 19 towns. There is a lack of coverage at towns of the southwest such as Scenic Vista, Terrapin Spring and Wilson Forest which have high radiation levels reported by the mobile sensors. | ||
| + | |||
| + | Among the static sensors, sensors 13 and 15 are too uncertain to trust as despite being beside the nuclear plant, 2.5 miles and 0.89 miles respectively, they are unable to detect radiation spikes. Furthermore, sensor 15 is unavailable throughout April 8, 10:06 PM to April 10, 8:45pm which is a crucial period as the earthquake might just happen before that. | ||
| + | |||
| + | |||
| + | |- | ||
| + | |||
| + | | | ||
| + | 4 | ||
| + | || | ||
| + | [[File:MobileSensorCoverage.png|900px|center]] | ||
| + | |||
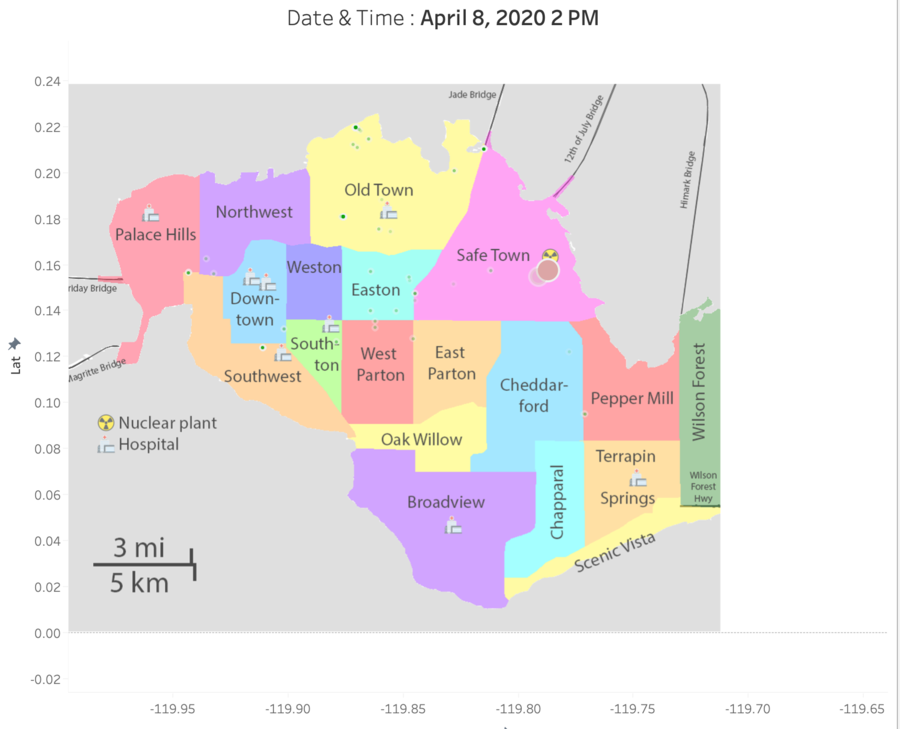
| + | Mobile sensors have a higher variation then static sensors due to their wide coverage. However, despite having wide coverage, they too present certain flaws and uncertainties when it comes to analysis. | ||
| + | |||
| + | '''1) Problem 1: Area of coverage''' | ||
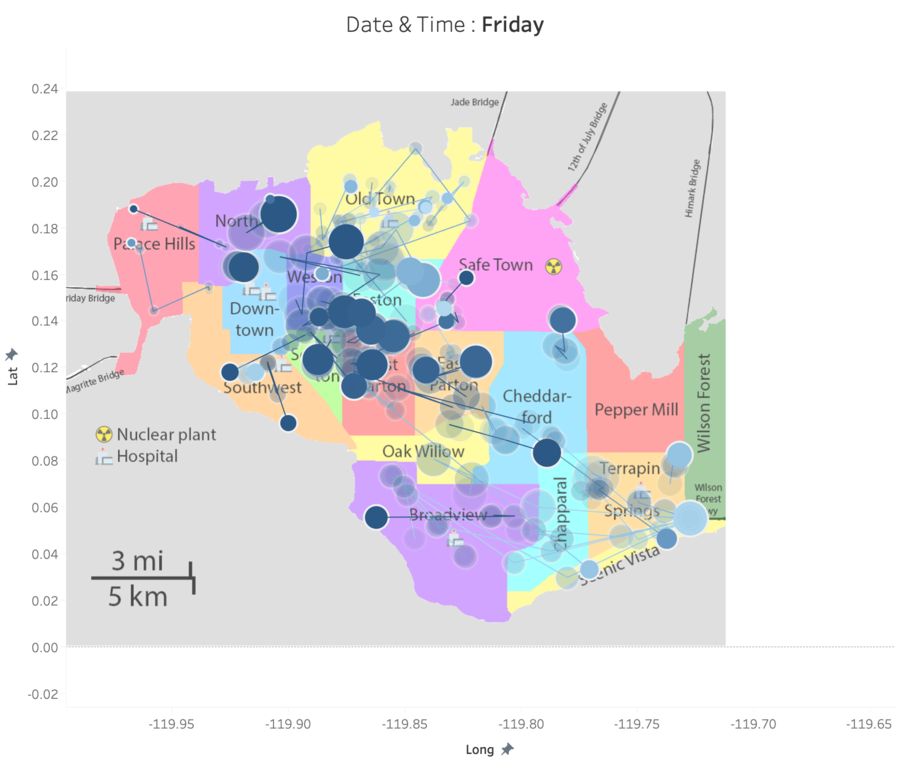
| + | As can be seen, by the above visualization, most of the sensors are situated around Northwest, Weston, Easton, Southton and West Parton which are areas of high activities. The history and trail options are activated to show the movements of sensors from 6 to 10 April. The mobile sensors coverage only gradually shift to the Northwest during Friday. There is thus high uncertainty as with a small sample size on these areas, the results might be swayed by one or two which are not working. Furthermore, there is a lack of static sensor coverage in these areas. | ||
| + | |||
| + | '''2) Problem 2: Wear and tear''' | ||
| + | |||
| + | Moving sensors present a greater chance of wear and tear and loss of signal when the owner traveling into a low connectivity area. This result in a greater loss of data as compared to the static sensors. | ||
| + | |||
| + | [[File:contanimatedcars.png|900px|center]] | ||
| + | |||
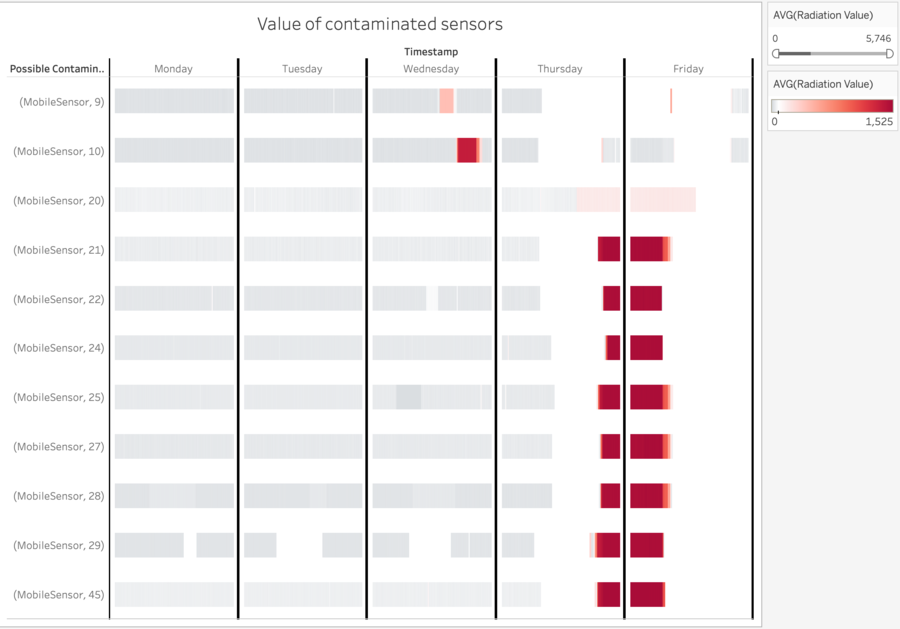
| + | The moving sensors which are too uncertain to trust are the sensors shown above which are sensors 9,10,20,21,22,24,25,27,28,29 and 45. From 9th April around 7 am onwards, these sensors show a high amount of missing data and inflated radiation values. | ||
| + | |||
| + | |||
| + | |- | ||
| + | |||
| + | |||
| + | |||
<br> | <br> | ||
| Line 73: | Line 139: | ||
===Which regions of the city have greater uncertainty of radiation measurement? Use visual analytics to explain your rationale. What effects do you see in the sensor readings after the earthquake and other major events? What effect do these events have on uncertainty?=== | ===Which regions of the city have greater uncertainty of radiation measurement? Use visual analytics to explain your rationale. What effects do you see in the sensor readings after the earthquake and other major events? What effect do these events have on uncertainty?=== | ||
---- | ---- | ||
| − | + | {| class="wikitable" style="background-color:#FFFFFF;" width="100%" | |
| − | + | |- | |
| − | + | ! style="font-weight: bold;background: #536a87;color:#fbfcfd;width: 10%;" | Step | |
| + | ! style="font-weight: bold;background: #536a87;color:#fbfcfd;width: 90%;" | Description | ||
| + | |- | ||
| + | | | ||
| + | 1 | ||
| + | || | ||
| + | [[File:MissingMobile.png|900px|center]] | ||
| + | '''Mobile''' | ||
| + | [[File:MissingStatic.png|900px|center]] | ||
| + | '''Static''' | ||
| + | |||
| + | There were missing data for both the Static and Mobile Sensors. | ||
| + | |||
| + | |- | ||
| + | | | ||
| + | 2 | ||
| + | || | ||
| + | |||
| + | [[File:EarthQuake.png|900px|center]] | ||
| + | [[File:Sensor9Pickup.png|900px|center]] | ||
| + | [[File:Sensor10Pickup.png|900px|center]] | ||
| + | |||
| + | The earthquake might have happened around 7.10am on 8th April. A bunch of mobile sensors lost connectivity on the morning of 8th April around 7.16 am - 7.30 am. This might have caused a radiation leak at the nuclear plant. Shortly afterward from 1.26 pm to 4.27 pm, Mobile Sensor 9 which is driving beside the nuclear plant (Distance from plant = 0.62 miles), detected an increase in radiation level to 1301. At 5 pm, there was a surge in radiation levels at the entrance of the Jade bridge (Distance from plant = 6.26 miles). | ||
| + | |||
| + | Subsequently, there is an increase in radiation levels among radiation levels from 8th April onwards and more sensors stopped functioning. | ||
| + | |||
| + | |- | ||
| + | |||
| + | | | ||
| + | 3 | ||
| + | || | ||
| + | [[File:StaticUncertainity.png|900px|center]] | ||
| + | |||
| + | The variation of static sensors is minimal as compared to the moving sensors. These shows uncertainty as they have minimal coverage being stationary. Furthermore, only 8 towns were covered out of the 19 towns. There is a lack of coverage at towns of the southwest such as Scenic Vista, Terrapin Spring and Wilson Forest which have high radiation levels reported by the mobile sensors. | ||
| + | |||
| + | Among the static sensors, sensors 13 and 15 are too uncertain to trust as despite being beside the nuclear plant, 2.5 miles and 0.89 miles respectively, they are unable to detect radiation spikes. Furthermore, sensor 15 is unavailable throughout April 8, 10:06 PM to April 10, 8:45pm which is a crucial period as the earthquake might just happen before that. | ||
| + | |||
| + | |||
| + | |- | ||
| + | |||
| + | | | ||
| + | 4 | ||
| + | || | ||
| + | [[File:MobileSensorCoverage.png|900px|center]] | ||
| + | |||
| + | Mobile sensors have a higher variation then static sensors due to their wide coverage. However, despite having wide coverage, they too present certain flaws and uncertainties when it comes to analysis. | ||
| + | |||
| + | '''1) Problem 1: Area of coverage''' | ||
| + | As can be seen, by the above visualization, most of the sensors are situated around Northwest, Weston, Easton, Southton and West Parton which are areas of high activities. The history and trail options are activated to show the movements of sensors from 6 to 10 April. The mobile sensors coverage only gradually shift to the Northwest during Friday. There is thus high uncertainty as with a small sample size on these areas, the results might be swayed by one or two which are not working. Furthermore, there is a lack of static sensor coverage in these areas. | ||
| + | |||
| + | '''2) Problem 2: Wear and tear''' | ||
| + | |||
| + | Moving sensors present a greater chance of wear and tear and loss of signal when the owner traveling into a low connectivity area. This result in a greater loss of data as compared to the static sensors. | ||
| + | |||
| + | [[File:contanimatedcars.png|900px|center]] | ||
| + | |||
| + | The moving sensors which are too uncertain to trust are the sensors shown above which are sensors 9,10,20,21,22,24,25,27,28,29 and 45. From 9th April around 7 am onwards, these sensors show a high amount of missing data and inflated radiation values. | ||
| + | |||
| + | |||
| + | |- | ||
== Question 3 == | == Question 3 == | ||
Revision as of 16:23, 13 October 2019
Contents
- 1 Question 1
- 2 Question 2
- 2.1 Use visual analytics to represent and analyze uncertainty in the measurement of radiation across the city. Compare uncertainty of the static sensors to the mobile sensors. What anomalies can you see? Are there sensors that are too uncertain to trust?
- 2.2 Which regions of the city have greater uncertainty of radiation measurement? Use visual analytics to explain your rationale. What effects do you see in the sensor readings after the earthquake and other major events? What effect do these events have on uncertainty?
- 3 Question 3
Question 1
Visualize radiation measurements over time from both static and mobile sensors to identify areas where radiation over background is detected. Characterize changes over time.
| Step | Description |
|---|---|
|
1 |
Mobile Sensors |
|
2 |
Static Sensors |
|
3 |
For the visualization of sensors over time, a Gantt chart view was created to analyze the values of radiation of both sensors. In general, places of concern include Old Town, Jade Bridge, and the southeast region which include Terrapin Springs, Wilson Forest and Scenic Vista. The time pills are set to continuous with "minutes" as the variable as the values are measured in counts per minute. The readings from mobile sensors support Static Sensors, which shows a spike in radiation on areas like Old Town, Jade Bridge, and the southeast region. |
Question 2
Use visual analytics to represent and analyze uncertainty in the measurement of radiation across the city. Compare uncertainty of the static sensors to the mobile sensors. What anomalies can you see? Are there sensors that are too uncertain to trust?
Which regions of the city have greater uncertainty of radiation measurement? Use visual analytics to explain your rationale. What effects do you see in the sensor readings after the earthquake and other major events? What effect do these events have on uncertainty?
| Step | Description |
|---|---|
|
1 |
Mobile Static There were missing data for both the Static and Mobile Sensors. |
|
2 |
The earthquake might have happened around 7.10am on 8th April. A bunch of mobile sensors lost connectivity on the morning of 8th April around 7.16 am - 7.30 am. This might have caused a radiation leak at the nuclear plant. Shortly afterward from 1.26 pm to 4.27 pm, Mobile Sensor 9 which is driving beside the nuclear plant (Distance from plant = 0.62 miles), detected an increase in radiation level to 1301. At 5 pm, there was a surge in radiation levels at the entrance of the Jade bridge (Distance from plant = 6.26 miles). Subsequently, there is an increase in radiation levels among radiation levels from 8th April onwards and more sensors stopped functioning. |
|
3 |
The variation of static sensors is minimal as compared to the moving sensors. These shows uncertainty as they have minimal coverage being stationary. Furthermore, only 8 towns were covered out of the 19 towns. There is a lack of coverage at towns of the southwest such as Scenic Vista, Terrapin Spring and Wilson Forest which have high radiation levels reported by the mobile sensors. Among the static sensors, sensors 13 and 15 are too uncertain to trust as despite being beside the nuclear plant, 2.5 miles and 0.89 miles respectively, they are unable to detect radiation spikes. Furthermore, sensor 15 is unavailable throughout April 8, 10:06 PM to April 10, 8:45pm which is a crucial period as the earthquake might just happen before that.
|
|
4 |
Mobile sensors have a higher variation then static sensors due to their wide coverage. However, despite having wide coverage, they too present certain flaws and uncertainties when it comes to analysis. 1) Problem 1: Area of coverage As can be seen, by the above visualization, most of the sensors are situated around Northwest, Weston, Easton, Southton and West Parton which are areas of high activities. The history and trail options are activated to show the movements of sensors from 6 to 10 April. The mobile sensors coverage only gradually shift to the Northwest during Friday. There is thus high uncertainty as with a small sample size on these areas, the results might be swayed by one or two which are not working. Furthermore, there is a lack of static sensor coverage in these areas. 2) Problem 2: Wear and tear Moving sensors present a greater chance of wear and tear and loss of signal when the owner traveling into a low connectivity area. This result in a greater loss of data as compared to the static sensors. The moving sensors which are too uncertain to trust are the sensors shown above which are sensors 9,10,20,21,22,24,25,27,28,29 and 45. From 9th April around 7 am onwards, these sensors show a high amount of missing data and inflated radiation values.
|
Question 3
Given the uncertainty you observed in question 2, are the radiation measurements reliable enough to locate areas of concern? Highlight potential locations of contamination, including the locations of contaminated cars. Should St. Himark officials be worried about contaminated cars moving around the city?
| Step | Description |
|---|---|
|
1 |
Mobile Static There were missing data for both the Static and Mobile Sensors. |
|
2 |
The earthquake might have happened around 7.10am on 8th April. A bunch of mobile sensors lost connectivity on the morning of 8th April around 7.16 am - 7.30 am. This might have caused a radiation leak at the nuclear plant. Shortly afterward from 1.26 pm to 4.27 pm, Mobile Sensor 9 which is driving beside the nuclear plant (Distance from plant = 0.62 miles), detected an increase in radiation level to 1301. At 5 pm, there was a surge in radiation levels at the entrance of the Jade bridge (Distance from plant = 6.26 miles). Subsequently, there is an increase in radiation levels among radiation levels from 8th April onwards and more sensors stopped functioning. |
|
3 |
The variation of static sensors is minimal as compared to the moving sensors. These shows uncertainty as they have minimal coverage being stationary. Furthermore, only 8 towns were covered out of the 19 towns. There is a lack of coverage at towns of the southwest such as Scenic Vista, Terrapin Spring and Wilson Forest which have high radiation levels reported by the mobile sensors. Among the static sensors, sensors 13 and 15 are too uncertain to trust as despite being beside the nuclear plant, 2.5 miles and 0.89 miles respectively, they are unable to detect radiation spikes. Furthermore, sensor 15 is unavailable throughout April 8, 10:06 PM to April 10, 8:45pm which is a crucial period as the earthquake might just happen before that.
|
|
4 |
Mobile sensors have a higher variation then static sensors due to their wide coverage. However, despite having wide coverage, they too present certain flaws and uncertainties when it comes to analysis. 1) Problem 1: Area of coverage As can be seen, by the above visualization, most of the sensors are situated around Northwest, Weston, Easton, Southton and West Parton which are areas of high activities. The history and trail options are activated to show the movements of sensors from 6 to 10 April. The mobile sensors coverage only gradually shift to the Northwest during Friday. There is thus high uncertainty as with a small sample size on these areas, the results might be swayed by one or two which are not working. Furthermore, there is a lack of static sensor coverage in these areas. 2) Problem 2: Wear and tear Moving sensors present a greater chance of wear and tear and loss of signal when the owner traveling into a low connectivity area. This result in a greater loss of data as compared to the static sensors. The moving sensors which are too uncertain to trust are the sensors shown above which are sensors 9,10,20,21,22,24,25,27,28,29 and 45. From 9th April around 7 am onwards, these sensors show a high amount of missing data and inflated radiation values.
|
| Step | Description |
|---|---|
|
1 |
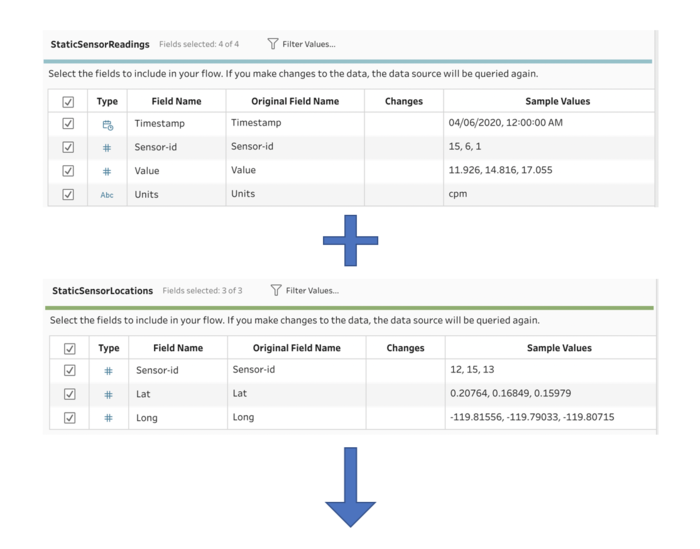
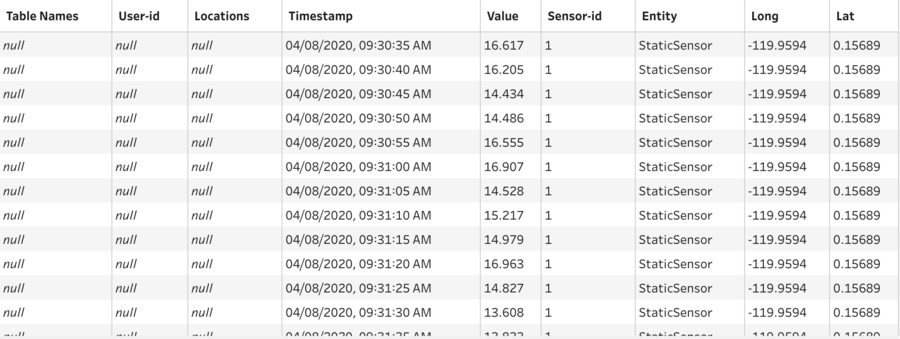
The static sensor data consist of two files. One of the files contains the longitudes and latitudes of the Sensors while the other file contains the timestamp of the sensors. Both files were combined utilizing an inner join by matching their Sensor IDs. |
|
2 |
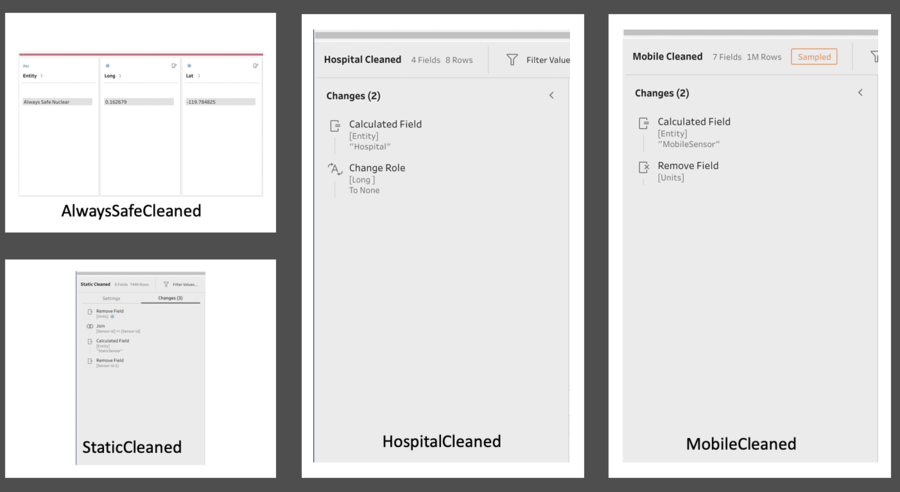
The column "Value" was removed from both the sensors file as it is redundant. A column "Entity" was created for all data to identify the respective data points." "MobileSensor" value in column "Entity" represents the data points belonging to mobile sensors. "StaticSensor" value in column "Entity" represents the data points belonging to static sensors. "Hospital" value in column "Entity" represents the data points belonging to hospitals. "Always Safe Nuclear" value in column "Entity" represents the data points belonging to Always Safe nuclear plant. These were used to differentiate the data points when combing the various data into one single data table which will be explained later.
|
|
3 |
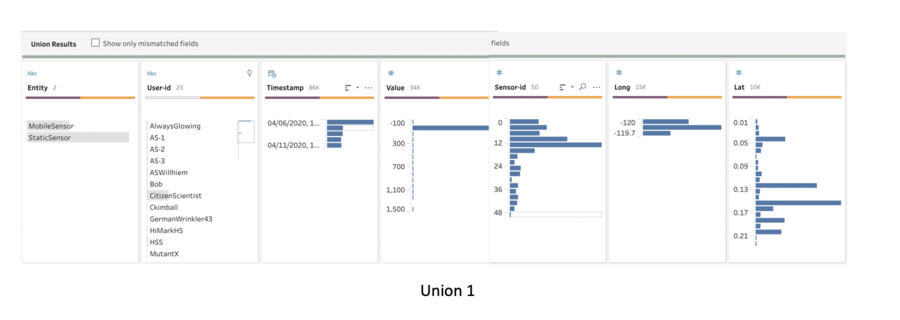
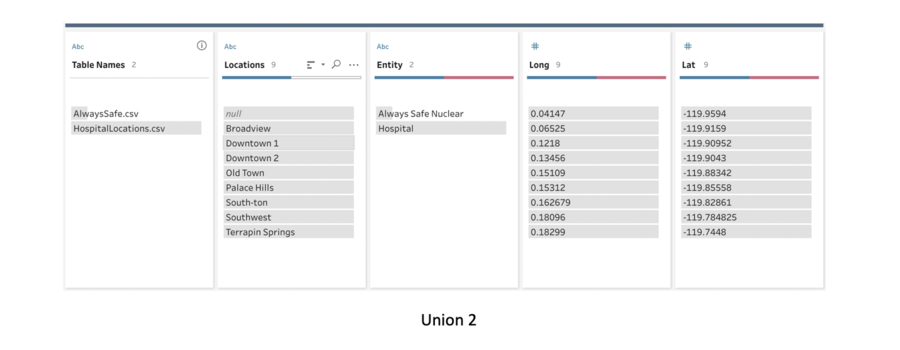
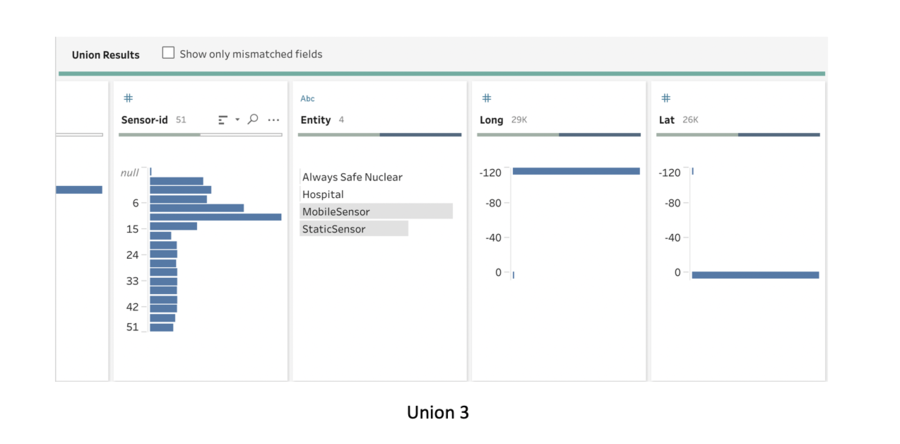
Next, we utilize the common field, "Entity", and the similarity in format and columns to create a union for the different datasets. |
|
4 |
The data is output as an extract and imported into Tableau. |
