Difference between revisions of "IS428 AY2019-20T1 Assign Benedict Then Question 2"
Jxthen.2017 (talk | contribs) |
Jxthen.2017 (talk | contribs) |
||
| Line 104: | Line 104: | ||
'''Conclusion'''<br> | '''Conclusion'''<br> | ||
| − | Hence, I would say that the region '''Safe Town''' where the nuclear plant is located has greater uncertainty of radiation measurement as Static Sensor 13 did not have expected radiation readings and Static Sensor 15 | + | Hence, I would say that the region '''Safe Town''' where the nuclear plant is located has greater uncertainty of radiation measurement as Static Sensor 13 did not have expected radiation readings and Static Sensor 15 located at '''Nuclear Plan''' had missing radiation readings during the occurrence of the major events. |
<br> | <br> | ||
Revision as of 11:52, 13 October 2019
|
|
|
|
|
|
2. Use visual analytics to represent and analyse uncertainty in the measurement of radiation across the city.
Visualization Information
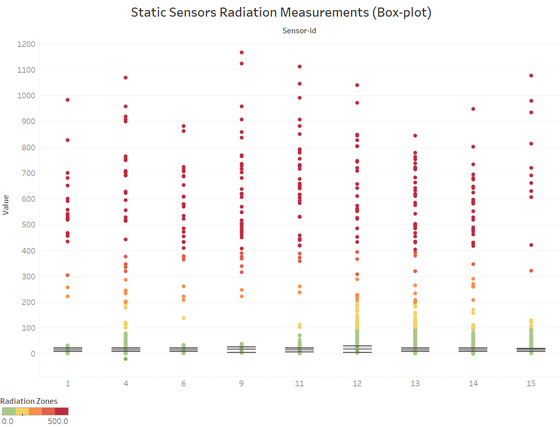
These box-plot visualisations show the spread of the radiation measurements of all sensors from 06/04/2020 to 10/04/2020. Each dot represents one radiation reading of a sensor at a timestamp (e.g. 06/04/2020 12:00:05 PM, static sensor 1, 20 cpm). (Timestamps is not taken into consideration for these visualizations)
What anomalies can you see?
To answer this question, box-plots visualizations were used to identify anomalies/outlier as it can tell us the shape of the distribution, its central value, and its variability.
Anomalies definition: something that deviates from what is standard, normal, or expected.
From both the Static and Mobile sensors box-plots visualization, the bulk of the radiation measurements are around the healthy (green) radiation zone which makes up the mean, median, upper/lower quantile. This is normal and expected as measurements should be low most of the time on normal days.
On the other hand, we can see that there are some high radiation measurements across all sensors (red zones). These can be classified as anomalies if we solely compared with the mean/median. However, these anomalies are standard across all sensors and expected as we know that there is an earthquake and radiation contamination which may result in all the high measurements. Hence, we can expect readings to shoot up to the hundreds or thousands when these events occurred. In this case, we do not classify them as anomalies as they are expected.
The only 2 extreme anomalies that can be identified:
- Static sensor 4 with -20 cpm. (radiation measurements do not go below 0)
- Mobile sensor 12 with 54,375 cpm. (extremely high as compared to the rest which are at most around 1,000cpm) (This data has been removed from the visualization as it will highly scale the visualization, making it not visible)
[Note] One of the disadvantages of the box-plots visualizations is that the timeline is not taken into consideration. To further identify anomalies, we will plot radiation measurements against the timestamps from 6/4/2020 to 10/4/20 to identify if there are anomalies at time periods that we should not expect.
Visualization Information:
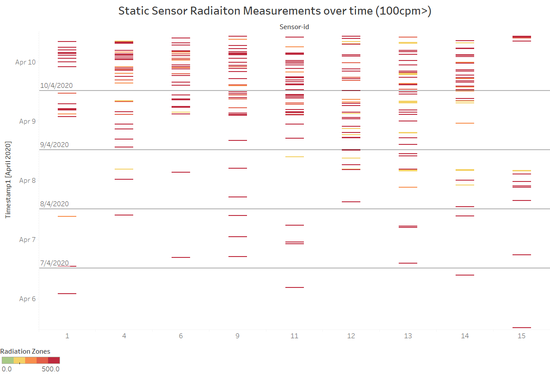
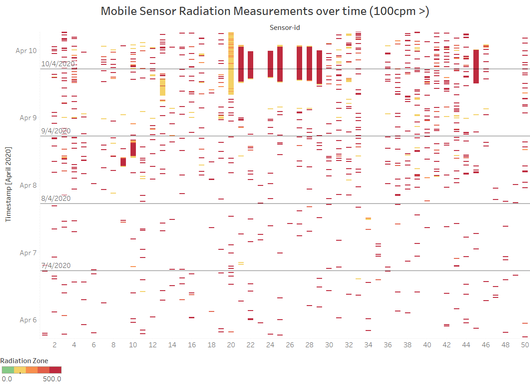
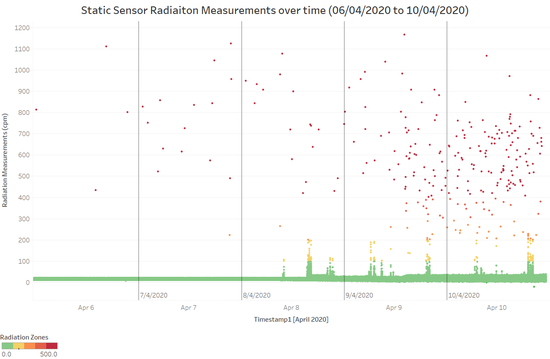
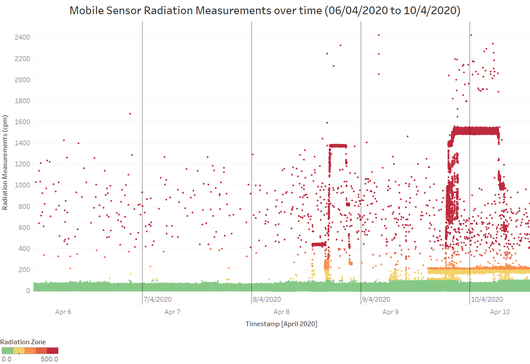
These visualisations only show radiation measurements above 100 cpm of all sensors from 06/04/2020 to 10/04/2020. Each dot represents one radiation reading of a sensor at a timestamp (e.g. 06/04/2020 12:00:05 PM, static sensor 1, 20 cpm). The point of only showing readings that are above 100 cpm is to focus on readings that are in the dangerous zone and also identify anomalies where in this case are high readings on a normal day.
Detecting anomalies from 6/4/2020 to 8/4/2020
Expectation: low radiation readings on a normal day
Anomalies: prolonged or frequent occurrences of high radiation readings on a normal day
Looking at each sensor individually from the visualization, there appear to be no anomalies. Majority of the time, each sensor have low radiation readings and occasional spikes from 6/4/2020 to 8/4/2020, which is expected on a normal day. An anomaly, in this case, will be prolonged or high occurrence of spikes from 6/4/2020 to 8/4/2020 where radiation readings should be low. However, we do not see such occurrences.
Detecting anomalies from 9/4/2020 to 10/4/2020
There are higher and prolonged radiation measurements from 9/4/2020 onwards which is expected as the earthquake and radiation contamination occurred around that time period. Hence, it is expected to see radiation readings rise during this time period. On the other hand, it is also normal to see Mobile or Static Sensors having low readings as they might not be near the major events at that time period.
Are there sensors that are too uncertain to trust?
We can see that for both Static and Mobile sensors, they all behave the same in terms of radiation measurements across the time periods. They have low radiation readings on normal days and higher radiation readings during the earthquake and contamination periods. Even if the sensors spikes, they reach up to hundreds or thousands which is standard across all sensors. Even though there are 2 extreme anomalies which has a value on 50k+ and -20, coming from mobile sensor 12 and static sensor 4 respectively. These extreme anomalies occurred only once throughout the 4 days.
All in all, from the visualizations above, there are no sensors that are too uncertain to trust as all of them have similar patterns in radiation measurements across the 4 days. All their readings were low before the earthquake and radiation confirmation, and high when it occurred. (Except some sensors which may be far away from the major events)
Visualization Information:
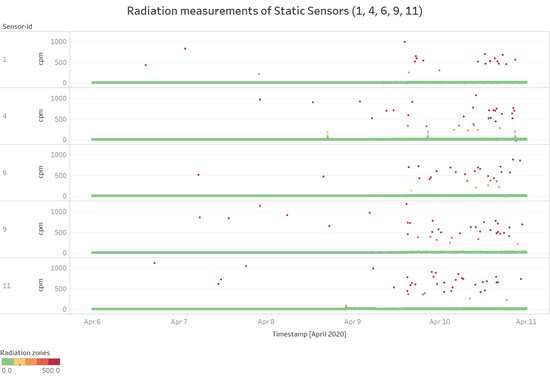
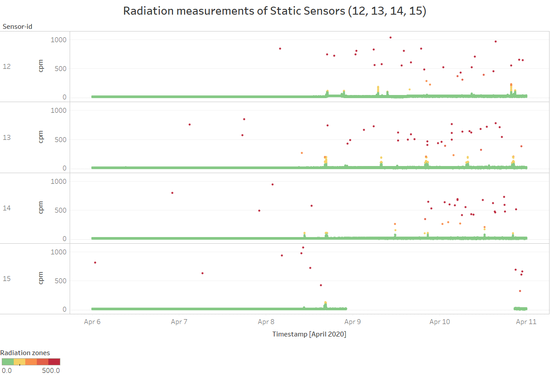
These visualisations show the radiation measurements of all static sensors individually from 06/04/2020 to 10/04/2020. Each dot represents one radiation reading of a sensor at a timestamp (e.g. 06/04/2020 12:00:05 PM, static sensor 1, 20 cpm).
Evaluation
For this question, to evaluate the region's radiation measurements, I will be focusing on the radiation measurements of the Static Sensors which are stationed at various regions in St' Himark's. We can see that the patterns of the radiation measurements from all sensors are around the same. They occasionally have a few spikes in readings before the earthquake and radiation contamination, and higher readings from 9/4/2020 when the events occurred.
Uncertain Static sensors
Except static sensor 13 and 15 which are located very near the nuclear plant. Since Static Sensor 13 is very close to the nuclear plant, it is reasonable to expect the radiation readings to be much higher on 9/4/2020 to 10/4/2020 when the earthquake and radiation contamination occurred. However, the radiation readings during the period for sensor 13 were low. This brings up greater uncertainty of the radiation measurements in terms of the accuracy of the Static Sensor 13. As for Static Sensor 15, there is a time gap from 9/4/2020 onwards resulting in no radiation readings.
Conclusion
Hence, I would say that the region Safe Town where the nuclear plant is located has greater uncertainty of radiation measurement as Static Sensor 13 did not have expected radiation readings and Static Sensor 15 located at Nuclear Plan had missing radiation readings during the occurrence of the major events.
Static Sensors
We can see the radiation readings from the Static Sensors have more frequent spikes after the period of the earthquake and containment leak. However, there are no obvious or prolonged high-level radiation readings. This can be expected as the static sensors are placed at different locations where some of it may be very far from the earthquake and containment leak. Hence, we do not see much activity for Static sensors. The only obvious effect is the time gap of sensor 15 which happens to be during the major events. This could possibly be due to the earthquake which may have caused Static sensor 15 to malfunction resulting in loss of radiation readings.
Mobile Sensors
We can see that certain Mobile Sensor readings spiked more frequently and for a prolonged period of time. This is likely due to the radiation contamination leak after the earthquake which containment the vehicles who are near the area at that point of time.
