Difference between revisions of "IS428 AY2019-20T1 Assign Lim Zi Yuan 4"
(/* Summarize the state of radiation measurements at the end of the available period. Use your novel visualizations and analysis approaches to suggest a course of action for the city. Use visual analytics to compare the static sensor network to the mobi...) |
(/* Summarize the state of radiation measurements at the end of the available period. Use your novel visualizations and analysis approaches to suggest a course of action for the city. Use visual analytics to compare the static sensor network to the mobi...) |
||
| Line 42: | Line 42: | ||
===Static Sensor=== | ===Static Sensor=== | ||
====Pros==== | ====Pros==== | ||
| − | Static Sensors have 24/7 uptime as compared to Mobile Sensors | + | <centre> |
| − | Static Sensors are more accurate | + | #Static Sensors have 24/7 uptime as compared to Mobile Sensors |
| − | Static Sensors are more Robust | + | #Static Sensors are more accurate |
| + | #Static Sensors are more Robust | ||
| + | </centre> | ||
| + | ====Cons==== | ||
| + | <centre> | ||
| + | #Static Sensors are more expensive to deploy | ||
| + | #Static Sensors provide readings only from the immediate area around them | ||
| + | #Static Sensors are more expensive to maintain | ||
| + | </centre> | ||
| − | |||
| − | |||
| − | |||
| − | |||
| − | |||
====Course of Action==== | ====Course of Action==== | ||
Static Sensors are only covering 9 out of 19 areas. More are needed to supplement coverage. | Static Sensors are only covering 9 out of 19 areas. More are needed to supplement coverage. | ||
| Line 59: | Line 62: | ||
====Pros==== | ====Pros==== | ||
| − | Mobile Sensors are cheap to deploy | + | <centre> |
| − | Mobile Sensors allow for wide coverage with numbers | + | #Mobile Sensors are cheap to deploy |
| − | + | #Mobile Sensors allow for wide coverage with numbers | |
| + | </centre> | ||
====Cons==== | ====Cons==== | ||
| − | Mobile Sensors are not operating 24/7 | + | <centre> |
| − | Mobile Sensors are more likely to break down | + | #Mobile Sensors are not operating 24/7 |
| − | Mobile Sensors do not detect radiation evenly | + | #Mobile Sensors are more likely to break down |
| + | #Mobile Sensors do not detect radiation evenly | ||
| + | </centre> | ||
====Course of Action==== | ====Course of Action==== | ||
Revision as of 03:05, 13 October 2019
VAST 2019 MC2: Citizen Science to the Rescue
|
|
|
|
|
Summarize the state of radiation measurements at the end of the available period. Use your novel visualizations and analysis approaches to suggest a course of action for the city. Use visual analytics to compare the static sensor network to the mobile sensor network. What are the strengths and weaknesses of each approach? How do they support each other?
Static Sensor
Pros
<centre>
- Static Sensors have 24/7 uptime as compared to Mobile Sensors
- Static Sensors are more accurate
- Static Sensors are more Robust
</centre>
Cons
<centre>
- Static Sensors are more expensive to deploy
- Static Sensors provide readings only from the immediate area around them
- Static Sensors are more expensive to maintain
</centre>
Course of Action
Static Sensors are only covering 9 out of 19 areas. More are needed to supplement coverage.
Mobile Sensor
Pros
<centre>
- Mobile Sensors are cheap to deploy
- Mobile Sensors allow for wide coverage with numbers
</centre>
Cons
<centre>
- Mobile Sensors are not operating 24/7
- Mobile Sensors are more likely to break down
- Mobile Sensors do not detect radiation evenly
</centre>
Course of Action
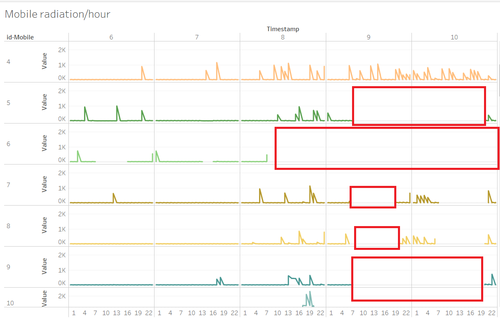
Based on the Graph, we can see that Mobile Sensors are not operational often enough resulting in missing data. A greater pool of such sensors are required to offset missing data.
Conclusion
Mobile and Static sensors go hand in hand. Static Sensors record radiation data of important points whilst Mobile Sensors record just about everything else.
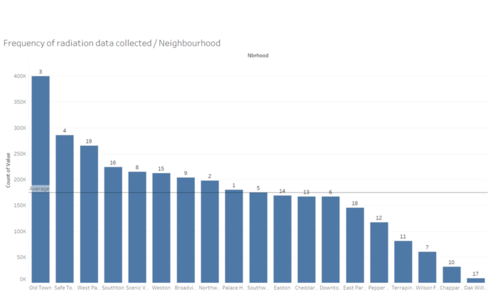
This graph shows the amount of radiation data recorded by each neighbourhood for mobile sensors. We can see that Oak Willows has extremely low volume of mobile data collected, this area could be seldom travelled due to poor road infrastructure or the path is simply not convenient. We can supplement this data with the addition of a few Static Sensors.

