Difference between revisions of "IS428 AY2019-20T1 Assign Benedict Then Ji Xiang Findings"
Jump to navigation
Jump to search
Jxthen.2017 (talk | contribs) |
Jxthen.2017 (talk | contribs) |
||
| Line 41: | Line 41: | ||
[[File:Cpmchart.jpg|thumb|400px|left|Source: http://fukushimaemergencywhatcanwedo.blogspot.com/2015/11/know-your-count-chart-reference-chart.html]] | [[File:Cpmchart.jpg|thumb|400px|left|Source: http://fukushimaemergencywhatcanwedo.blogspot.com/2015/11/know-your-count-chart-reference-chart.html]] | ||
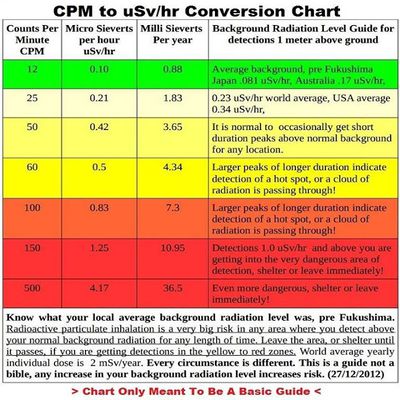
| − | This chart is a guide to let people better understand the different radiation levels instead of showing them cpm measurements where the majority | + | This chart is a guide to let people better understand the different radiation levels instead of showing them cpm measurements where the majority do not know what it means or how to interpret it. Throughout my findings, analysis and visualization, I will be using this chart as a common point of reference for so that it is more intuitive and easier to understand my visualizations which will consist of radiation measurements. In addition, I will be using this chart as a reference to identify characteristics, patterns or anomalies during major events in St'Himark. |
Revision as of 01:00, 13 October 2019
|
|
|
|
|
|
Point of Reference For Analysis
This chart is a guide to let people better understand the different radiation levels instead of showing them cpm measurements where the majority do not know what it means or how to interpret it. Throughout my findings, analysis and visualization, I will be using this chart as a common point of reference for so that it is more intuitive and easier to understand my visualizations which will consist of radiation measurements. In addition, I will be using this chart as a reference to identify characteristics, patterns or anomalies during major events in St'Himark.

