Difference between revisions of "IS428 AY2019-20T1 Assign Damian Er Zhong Ying Conclusion"
Jump to navigation
Jump to search
| Line 30: | Line 30: | ||
<font size="4"><font color="#43464b">'''Conclusion'''</font></font> | <font size="4"><font color="#43464b">'''Conclusion'''</font></font> | ||
| + | |||
In conclusion, the following were the main insights from the visualisation: | In conclusion, the following were the main insights from the visualisation: | ||
# The Pre Quake occured on 6th April at around 4pm and the Major Quake occured on 8th April at around 8am. The visualisation further uncovered evidences of aftershocks in the days following the earthquake in 9th and 10th April. | # The Pre Quake occured on 6th April at around 4pm and the Major Quake occured on 8th April at around 8am. The visualisation further uncovered evidences of aftershocks in the days following the earthquake in 9th and 10th April. | ||
Latest revision as of 19:49, 13 October 2019

VAST Challenge 2019 Mini-Challenge 1:
Crowdsourcing for Situational Awareness
|
|
|
|
|
|
Conclusion
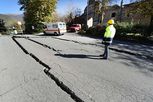
In conclusion, the following were the main insights from the visualisation:
- The Pre Quake occured on 6th April at around 4pm and the Major Quake occured on 8th April at around 8am. The visualisation further uncovered evidences of aftershocks in the days following the earthquake in 9th and 10th April.
- There are unreliability in the reports with regard to the reported damage in neighbourhoods such as Scenic Vista and Palace Hills. However, most of the neighbourhoods provided reliable shake intensity reports.
References
The following references have been extremely useful in completion of this visualisation:
- Cleaning with Data Interpreter (https://help.tableau.com/current/pro/desktop/en-us/data_interpreter.htm)
- Single Label per mark on map (https://community.tableau.com/thread/130393)
Comments