Difference between revisions of "IS428 AY2019-20T1 Assign Sean Chai Shong Hee Q2"
| Line 54: | Line 54: | ||
| − | The calculated field <b> Average Value </b> will help determine | + | The calculated field <b> Value > Average Value </b> will help determine if the value recorded is higher than the average recorded radiation value of the neighbourhood for a particular day. |
| + | |||
| + | === Certainty of static sensors === | ||
| + | |||
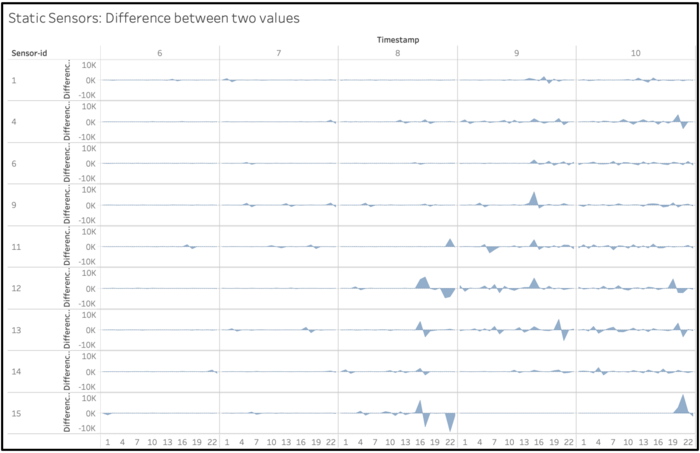
| + | Before carrying out visualisations for the uncertainty of static sensors, I wanted to first find out the certainty of static sensors. This was done by visualising the variation in values recorded by static sensors. | ||
| + | |||
| + | [[File:Static Difference.png|700px|thumb|center|<center> Area graph showing difference between two values </center>]] | ||
| + | |||
| + | The area chart shows how values recorded by the static sensors vary with the previous value recorded. Here, we can see the variations in values recorded. Generally, there is little variation between consecutive values recorded. This indicates that the static sensors are consistent in their measurements of radiation values. | ||
| + | |||
| + | === Uncertainty of static sensors === | ||
| + | |||
| + | [[File:Static Missing Value.png|700px|thumb|center|<center> Scatter plot highlighting values recorded that are above the average values for the day </center>]] | ||
| + | |||
| + | Monitoring activities for static sensor 15 ceased from 8th April at 10pm and only resumed on the 10th of April at 8pm. Static sensor 15 may have malfunctioned due to exposure to high levels of nuclear radiation. Being situated at the entrance of the nuclear power plant, static sensor 15 would have been exposed to the heaviest dose of radiation leakage. The pattern of malfunction is also consistent with the behaviours of many of the mobile sensors. Many mobile sensors suffered malfunctions at the same time period where static sensor 15 malfunctioned. | ||
| + | |||
| + | |||
| + | |||
| + | |||
| + | |||
| + | === Uncertainty of mobile sensors === | ||
| + | |||
| + | A graph was plotted to determine sensors whose recorded radiation values were higher than the average radiation values of the neighbourhood where measurements were made. | ||
| + | |||
| + | I observed a significant amount of missing values at identical time intervals from 9th to 10th of April. The occurrence of malfunctions in mobile sensors at similar time intervals suggests the presence of large amounts of nuclear radiation. Nuclear radiation can cause effects similar to electro-magnetic pulses, which disrupts the operations of electronics. In this case, it may have caused mobile sensors to malfunction. | ||
| + | |||
| + | The theory of mobile sensor's exposure to radiation leakage is further substantiated by the fact that values of radiation levels higher than that of the average value recorded in the neighbourhood was observed. Specifically, when mobile sensors 20,21,22,24,25,27,28,29,45 and 46 came online at around 6pm on 9 April, their readings were higher than the average value recorded for the day. These mobile sensors might have been contaminated by the radioactive leakage. | ||
| + | |||
| + | |||
| + | |||
| + | |||
| + | We can conclude that static sensors have higher certainties in their measurements than mobile sensors. | ||
| + | |||
| + | === Regions in city with higher uncertainty of radiation measurements === | ||
Revision as of 05:41, 13 October 2019
This section will answer questions for Mini Case 2
Contents
Question 2
Calculated field: Average value of radiation by neighbourhood per day
Two calculated fields were created during the data preparation phase:
| Calculated Field Name | Formula | Explanation |
|---|---|---|
The calculated field Value > Average Value will help determine if the value recorded is higher than the average recorded radiation value of the neighbourhood for a particular day.
Certainty of static sensors
Before carrying out visualisations for the uncertainty of static sensors, I wanted to first find out the certainty of static sensors. This was done by visualising the variation in values recorded by static sensors.
The area chart shows how values recorded by the static sensors vary with the previous value recorded. Here, we can see the variations in values recorded. Generally, there is little variation between consecutive values recorded. This indicates that the static sensors are consistent in their measurements of radiation values.
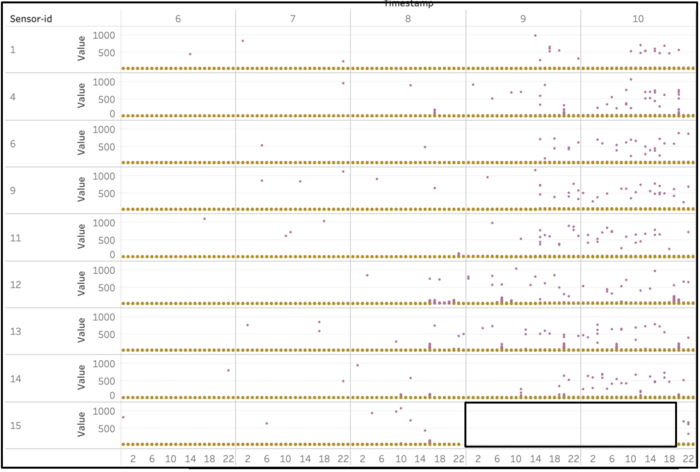
Uncertainty of static sensors
Monitoring activities for static sensor 15 ceased from 8th April at 10pm and only resumed on the 10th of April at 8pm. Static sensor 15 may have malfunctioned due to exposure to high levels of nuclear radiation. Being situated at the entrance of the nuclear power plant, static sensor 15 would have been exposed to the heaviest dose of radiation leakage. The pattern of malfunction is also consistent with the behaviours of many of the mobile sensors. Many mobile sensors suffered malfunctions at the same time period where static sensor 15 malfunctioned.
Uncertainty of mobile sensors
A graph was plotted to determine sensors whose recorded radiation values were higher than the average radiation values of the neighbourhood where measurements were made.
I observed a significant amount of missing values at identical time intervals from 9th to 10th of April. The occurrence of malfunctions in mobile sensors at similar time intervals suggests the presence of large amounts of nuclear radiation. Nuclear radiation can cause effects similar to electro-magnetic pulses, which disrupts the operations of electronics. In this case, it may have caused mobile sensors to malfunction.
The theory of mobile sensor's exposure to radiation leakage is further substantiated by the fact that values of radiation levels higher than that of the average value recorded in the neighbourhood was observed. Specifically, when mobile sensors 20,21,22,24,25,27,28,29,45 and 46 came online at around 6pm on 9 April, their readings were higher than the average value recorded for the day. These mobile sensors might have been contaminated by the radioactive leakage.
We can conclude that static sensors have higher certainties in their measurements than mobile sensors.

