Difference between revisions of "IS428 AY2019-20T1 Assign Nurul Khairina Binte Abdul Kadir TaskFindings Q3"
| Line 83: | Line 83: | ||
Another key observation would be that there is a relationship between shake intensity and the number of reports. People may report the damage out of panic during the main shock and this would explain the spike in reports on 8 April. Furthermore, we also have to consider that the reported impact scores could have been inflated on 8 April. Another factor that will increase uncertainty would be the power outages in some neighbourhoods like Chapparal and Wilson Forest. Therefore, the data after the earthquake on 8 April is more certain as compared to the other days. | Another key observation would be that there is a relationship between shake intensity and the number of reports. People may report the damage out of panic during the main shock and this would explain the spike in reports on 8 April. Furthermore, we also have to consider that the reported impact scores could have been inflated on 8 April. Another factor that will increase uncertainty would be the power outages in some neighbourhoods like Chapparal and Wilson Forest. Therefore, the data after the earthquake on 8 April is more certain as compared to the other days. | ||
| + | |- | ||
| + | | <center>'''Conditions change over time'''</center> | ||
| + | || | ||
| + | |||
| + | holaa | ||
|} | |} | ||
Revision as of 23:39, 12 October 2019
VAST 2019 MC1: Crowdsourcing for Situational Awareness
|
|
|
|
|
|
Question: How do conditions change over time? How does uncertainty in change over time? Describe the key changes you see. Limit your response to 500 words and 8 images.
| Summary | Detailed Description |
|---|---|
|
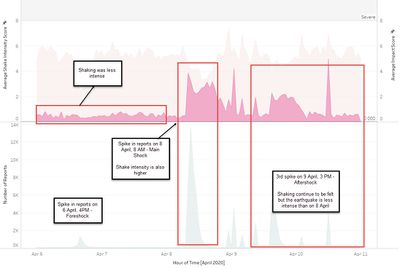
Previously, we considered the possibility that a spike in reports could be due to tremors from the earthquake on 8 April or a 2nd earthquake could have happened. Before we begin the analysis, we should understand more about the nature of an earthquake. Here are the research results that is relevant for our analysis. Earthquake comes in clusters and there can be foreshock, main shock and after shock. A foreshock is an earthquake that occurs before a larger seismic event (main shock). For example, a foreshock can occur from a matter of minutes to days or even longer before the main shock (The 2002 Sumatra earthquake is regarded as a foreshock of the 2004 Indian Ocean earthquake with a delay of more than two years between the two events). Wikipedia also mentioned that “the designation of an earthquake as foreshock, mainshock or aftershock is only possible after the full sequence of events has happened.” For this question, we will assume that there are a total of 3 earthquakes to understand more about the uncertainty in the data. Based on the research results, we can observe that the first spike in reports on 6 April at 4 PM could be the foreshock. In the shake map, the shake map also showed that the perceived damage is Not Felt. Since the shaking is not intense, not many people report it and the emergency team would have made announcements to warn the citizens of the impending disaster. Since the application was released before the earthquake, the citizens might be new to it and a pre-emergency exercise could have been conducted to prepare the citizens for the main earthquake. The mainshock can be identified by the spike on 8 April, 8 AM, 2 days after the foreshock. The main shock tend to be largest earthquake in the sequence and this will cause citizens to panic. The average shake intensity appear to be higher during this period. The aftershock is the last spike in reports on 9 April, 3 PM. The aftershock is a smaller earthquake that follows a larger earthquake in the same area of the main shock. This can be supported by the analysis we did in Question 2 where we suspected that there could be a 2nd earthquake. The average shake intensity is also lower as compared to the previous day since it is a smaller earthquake. Another key observation would be that there is a relationship between shake intensity and the number of reports. People may report the damage out of panic during the main shock and this would explain the spike in reports on 8 April. Furthermore, we also have to consider that the reported impact scores could have been inflated on 8 April. Another factor that will increase uncertainty would be the power outages in some neighbourhoods like Chapparal and Wilson Forest. Therefore, the data after the earthquake on 8 April is more certain as compared to the other days. | |
|
|

