Difference between revisions of "IS428 AY2019-20T1 Assign Sean Chai Shong Hee Q4"
(Created page with "<div style="background: #778899 ; letter-spacing:-0.08em;font-size:20px"><font color=#778899 face="Times New Roman"><b>Mini Case Challenge 2: Visualising Radiation Measurement...") |
|||
| (3 intermediate revisions by the same user not shown) | |||
| Line 26: | Line 26: | ||
| style="vertical-align:top;width:20%;" | <div style="padding: 3px; line-height: wrap_content; border-bottom:1px inset #778899; font-family:Times New Roman"> [[IS428_AY2019-20T1_Assign_Sean_Chai_Shong_Hee_Q1 |<font color =#008e97 ><b>QUESTION 1</b></font>]] | | style="vertical-align:top;width:20%;" | <div style="padding: 3px; line-height: wrap_content; border-bottom:1px inset #778899; font-family:Times New Roman"> [[IS428_AY2019-20T1_Assign_Sean_Chai_Shong_Hee_Q1 |<font color =#008e97 ><b>QUESTION 1</b></font>]] | ||
| − | | style="vertical-align:top;width:20%;" | <div style="padding: 3px; line-height: wrap_content; border-bottom: | + | | style="vertical-align:top;width:20%;" | <div style="padding: 3px; line-height: wrap_content; border-bottom:1px inset #778899; font-family:Times New Roman"> [[IS428_AY2019-20T1_Assign_Sean_Chai_Shong_Hee_Q2| <font color =#008e97 ><b>QUESTION 2</b></font>]] |
| − | | style="vertical-align:top;width:20%;" | <div style="padding: 3px; line-height: wrap_content; border-bottom: | + | | style="vertical-align:top;width:20%;" | <div style="padding: 3px; line-height: wrap_content; border-bottom:1px inset #778899; font-family:Times New Roman"> [[IS428_AY2019-20T1_Assign_Sean_Chai_Shong_Hee_Q3 | <font color =#008e97 ><b>QUESTION 3</b></font>]] |
| − | | style="vertical-align:top;width:20%;" | <div style="padding: 3px; line-height: wrap_content; border-bottom: | + | | style="vertical-align:top;width:20%;" | <div style="padding: 3px; line-height: wrap_content; border-bottom:5px double #778899; font-family:Times New Roman"> [[IS428_AY2019-20T1_Assign_Sean_Chai_Shong_Hee_Q4 | <font color =#008e97 ><b>QUESTION 4</b></font>]] |
| style="vertical-align:top;width:20%;" | <div style="padding: 3px; line-height: wrap_content; border-bottom:1px inset #778899; font-family:Times New Roman"> [[IS428_AY2019-20T1_Assign_Sean_Chai_Shong_Hee_Q5 | <font color =#008e97 ><b>QUESTION 5</b></font>]] | | style="vertical-align:top;width:20%;" | <div style="padding: 3px; line-height: wrap_content; border-bottom:1px inset #778899; font-family:Times New Roman"> [[IS428_AY2019-20T1_Assign_Sean_Chai_Shong_Hee_Q5 | <font color =#008e97 ><b>QUESTION 5</b></font>]] | ||
| Line 40: | Line 40: | ||
== Question 4 == | == Question 4 == | ||
| − | === | + | === Summary of insights gained === |
| − | Radiation measurements have insofar been effective in evaluating if areas are within healthy radiation levels. They have also been effective in determining areas that might have been contaminated by radiation. | + | |
| + | Radiation measurements have insofar been effective in evaluating if areas are within healthy radiation levels. They have also been effective in determining areas that might have been contaminated by radiation. Through visualisation, contaminated vehicles have been identified, and their routes after contamination have also been mapped out. | ||
| + | |||
| + | [[File:Static summary.png|700px|thumb|center]] | ||
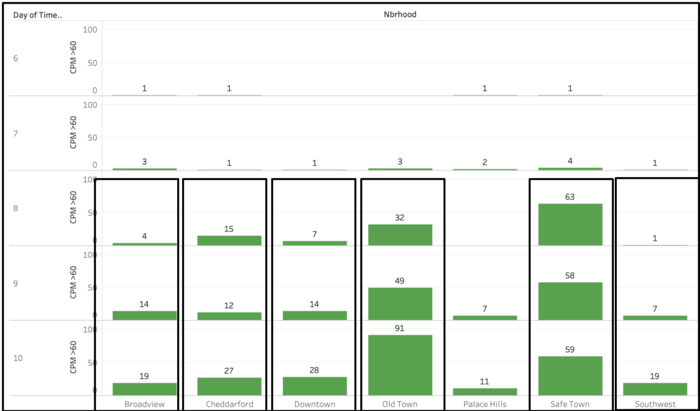
| + | Background radiation values are on the rise, as the number of values recorded being more than the base background radiation value of 60 cpm increases. At the end of the 10th of April, there has been no indication that radiation levels will fall. Rather, it appears that radiation contamination is spreading across the city of St. Himark. City officials should act on containment measures as soon as possible. | ||
| + | |||
| + | [[File:Mobile & Static.png|700px|thumb|center]] | ||
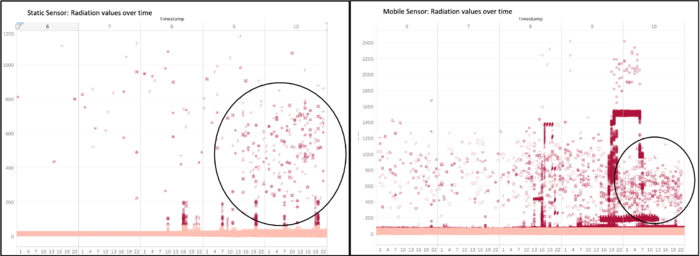
| + | Data collected from both static and mobile sensors show that towards the end of 10th April, there is a substantially high concentration of values in the range of 200-1000 cpm. | ||
| + | |||
| + | === Banes and boons of static sensors and mobile sensors === | ||
| + | The main strength of static sensors comes from its ability to accurately measure values. We can know with more certainty the day to day or hour to hour changes in radiation levels in the city. | ||
| + | |||
| + | [[File:Statc trend.png|500px|thumb|center]] | ||
| + | |||
| + | As compared to readings from mobile sensors, static sensors are able to clearly show us trends due to more accurate measurements of radiation values. | ||
| + | |||
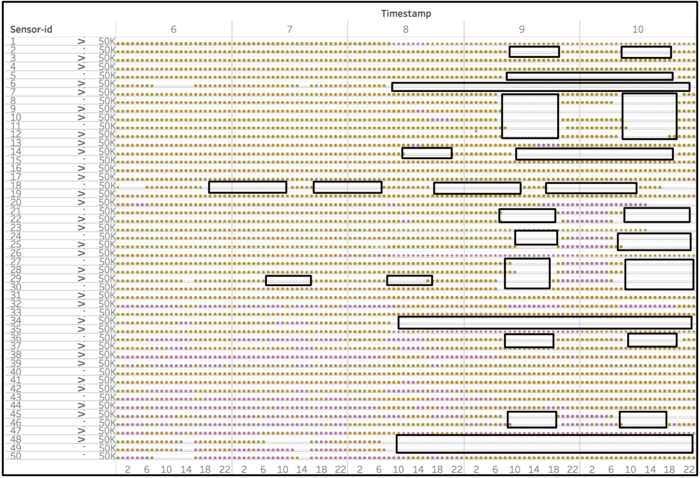
| + | Nevertheless, static sensors are susceptible to malfunctions as well. Due to the scarce number of static sensors, downtimes have big impacts on measurements of radiation levels. | ||
| + | |||
| + | [[File:Static Missing Value.png|700px|thumb|center]] | ||
| + | As illustrated by this visualisation, malfunction in Static Sensor 15 means there will be no data collected throughout the period of malfunction for Safe Town. It Static Sensor 13 malfunctioned due to radiation damage, we would not have any values of Safe Town collected, and we will not be able to know the seriousness of the radiation leakage. | ||
| + | |||
| + | [[File:Missing Values Mobile.png|700px|thumb|center]] | ||
| + | On the other hand, a benefit of having mobile sensors is that there will always be a large amount of data collected in spite of malfunctions. When one mobile sensor malfunctions, many other mobile sensors will be able to keep track of radiation values in the neighbourhood. | ||
| + | |||
| + | Mobile sensors are also useful in determining the concentration of radiation at different parts of the neighbourhood. While static sensors gives readings specific to the location it is situated, mobile sensors have the advantage of mobility and can collect measurements from different corners of the city. | ||
| + | |||
| + | However, uncertainties in measurements are a bane for mobile sensors. It is difficult to accurately determine what the readings from mobile sensors suggest without cross-validating the readings with static sensors. | ||
=== Course of action === | === Course of action === | ||
| − | + | Moving forward, the city should first look to isolate vehicles in possession of contaminated mobile sensors. These vehicles are at risk of spreading the contamination. The priority would be to isolate the vehicle carrying mobile sensor 46 as it frequently travels between multiple neighbourhoods. | |
| + | |||
| + | Next, the city should work on containment of the radioactive contamination. We can evidently see that radiation values are on the rise. According to the National Radiation Network, radiation levels above 100 cpm are very detrimental to health. | ||
Latest revision as of 19:50, 13 October 2019
This section will answer questions for Mini Case 2
Contents
Question 4
Summary of insights gained
Radiation measurements have insofar been effective in evaluating if areas are within healthy radiation levels. They have also been effective in determining areas that might have been contaminated by radiation. Through visualisation, contaminated vehicles have been identified, and their routes after contamination have also been mapped out.
Background radiation values are on the rise, as the number of values recorded being more than the base background radiation value of 60 cpm increases. At the end of the 10th of April, there has been no indication that radiation levels will fall. Rather, it appears that radiation contamination is spreading across the city of St. Himark. City officials should act on containment measures as soon as possible.
Data collected from both static and mobile sensors show that towards the end of 10th April, there is a substantially high concentration of values in the range of 200-1000 cpm.
Banes and boons of static sensors and mobile sensors
The main strength of static sensors comes from its ability to accurately measure values. We can know with more certainty the day to day or hour to hour changes in radiation levels in the city.
As compared to readings from mobile sensors, static sensors are able to clearly show us trends due to more accurate measurements of radiation values.
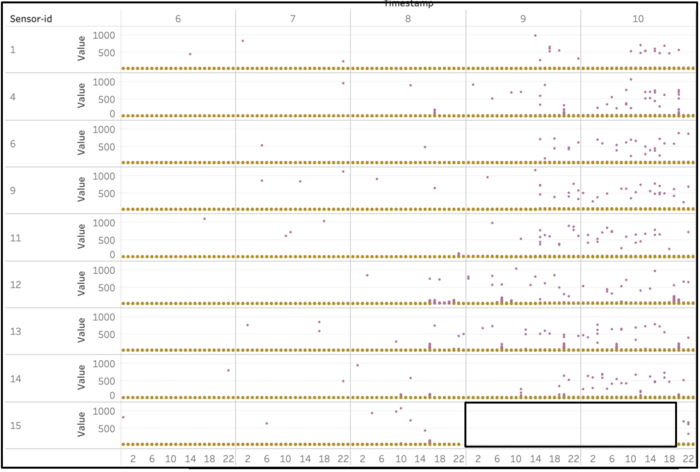
Nevertheless, static sensors are susceptible to malfunctions as well. Due to the scarce number of static sensors, downtimes have big impacts on measurements of radiation levels.
As illustrated by this visualisation, malfunction in Static Sensor 15 means there will be no data collected throughout the period of malfunction for Safe Town. It Static Sensor 13 malfunctioned due to radiation damage, we would not have any values of Safe Town collected, and we will not be able to know the seriousness of the radiation leakage.
On the other hand, a benefit of having mobile sensors is that there will always be a large amount of data collected in spite of malfunctions. When one mobile sensor malfunctions, many other mobile sensors will be able to keep track of radiation values in the neighbourhood.
Mobile sensors are also useful in determining the concentration of radiation at different parts of the neighbourhood. While static sensors gives readings specific to the location it is situated, mobile sensors have the advantage of mobility and can collect measurements from different corners of the city.
However, uncertainties in measurements are a bane for mobile sensors. It is difficult to accurately determine what the readings from mobile sensors suggest without cross-validating the readings with static sensors.
Course of action
Moving forward, the city should first look to isolate vehicles in possession of contaminated mobile sensors. These vehicles are at risk of spreading the contamination. The priority would be to isolate the vehicle carrying mobile sensor 46 as it frequently travels between multiple neighbourhoods.
Next, the city should work on containment of the radioactive contamination. We can evidently see that radiation values are on the rise. According to the National Radiation Network, radiation levels above 100 cpm are very detrimental to health.
