Difference between revisions of "IS428 AY2019-20T1 Assign Sean Chai Shong Hee Q3"
| (7 intermediate revisions by the same user not shown) | |||
| Line 26: | Line 26: | ||
| style="vertical-align:top;width:20%;" | <div style="padding: 3px; line-height: wrap_content; border-bottom:1px inset #778899; font-family:Times New Roman"> [[IS428_AY2019-20T1_Assign_Sean_Chai_Shong_Hee_Q1 |<font color =#008e97 ><b>QUESTION 1</b></font>]] | | style="vertical-align:top;width:20%;" | <div style="padding: 3px; line-height: wrap_content; border-bottom:1px inset #778899; font-family:Times New Roman"> [[IS428_AY2019-20T1_Assign_Sean_Chai_Shong_Hee_Q1 |<font color =#008e97 ><b>QUESTION 1</b></font>]] | ||
| − | | style="vertical-align:top;width:20%;" | <div style="padding: 3px; line-height: wrap_content; border-bottom: | + | | style="vertical-align:top;width:20%;" | <div style="padding: 3px; line-height: wrap_content; border-bottom:1px inset #778899; font-family:Times New Roman"> [[IS428_AY2019-20T1_Assign_Sean_Chai_Shong_Hee_Q2| <font color =#008e97 ><b>QUESTION 2</b></font>]] |
| style="vertical-align:top;width:20%;" | <div style="padding: 3px; line-height: wrap_content; border-bottom:5px double #778899; font-family:Times New Roman"> [[IS428_AY2019-20T1_Assign_Sean_Chai_Shong_Hee_Q3 | <font color =#008e97 ><b>QUESTION 3</b></font>]] | | style="vertical-align:top;width:20%;" | <div style="padding: 3px; line-height: wrap_content; border-bottom:5px double #778899; font-family:Times New Roman"> [[IS428_AY2019-20T1_Assign_Sean_Chai_Shong_Hee_Q3 | <font color =#008e97 ><b>QUESTION 3</b></font>]] | ||
| Line 39: | Line 39: | ||
== Question 3 == | == Question 3 == | ||
| + | |||
| + | === Reliability of sensors === | ||
| + | The reliability of the sensors in locating areas of concerns depends on what we are trying to determine. If we are looking to determine if the readings are reliable in helping us determine background radiation levels, then contaminated sensors might give unreliable readings. However, if we are trying to determine areas where radioactive contamination might have spread to, data from contaminated sensors will be able to show us areas that are likely to be contaminated. | ||
| + | |||
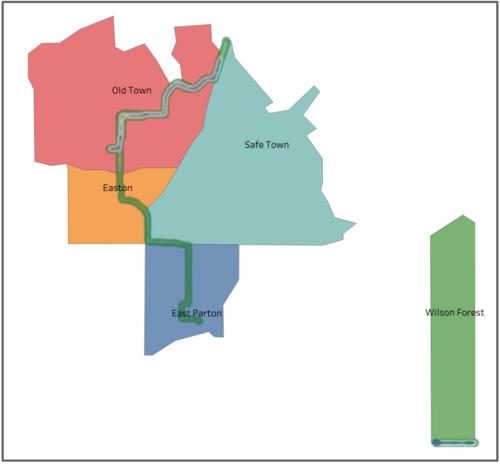
| + | [[File:Travel path.png|500px|thumb|center|<center> Path of travel of vehicles suspected of radioactive contamination </center>]] | ||
| + | |||
| + | The map above shows areas where potentially contaminated cars have travelled to after contamination. | ||
| + | |||
| + | Contaminated cars are a cause for concern because they will spread the contamination to areas where they travel to. Officials should work on identifying these cars and isolate them. | ||
| + | |||
| + | |||
| + | === Number of contaminated cars === | ||
| + | The estimated number of contaminated cars amount to 9. These cars will be cars in possession of the following sensors: | ||
| + | {| class="wikitable" | ||
| + | |- | ||
| + | ! <center>Contaminated sensor-ID | ||
| + | |- | ||
| + | | <center>21, 22, 24, 25, 27, 28, 29, 45, 46 | ||
| + | |} | ||
| + | |||
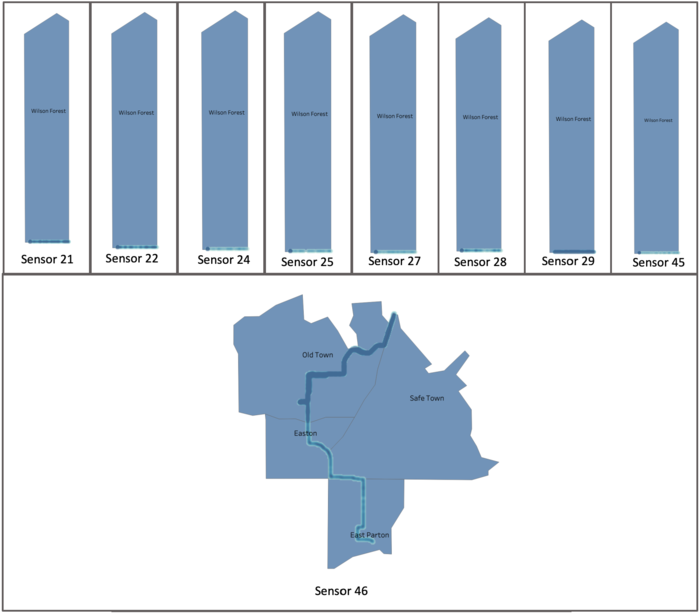
| + | [[File:Travel path by sensor.png|700px|thumb|center|<center> Travel path of potentially contaminated cars </center>]] | ||
| + | |||
| + | Of the 9 identified cars, only one (car fitted with sensor 46) has travelled across multiple neighbourhoods. As can be seen by the locality of the sensors, the other 8 sensors have only travelled within Wilson Forest ever since their contamination. | ||
| + | |||
| + | === Areas in need of additional monitoring infrastructure === | ||
| + | |||
| + | Areas in need of additional sensors are areas identified in Question 2. These areas include: | ||
| + | * Oak Willow | ||
| + | * Chapparel | ||
| + | * Wilson Forest | ||
| + | * Terrapin Springs | ||
| + | * Pepper Mill | ||
| + | |||
| + | More sensors are needed to better measure the radiation values in these neighbourhoods. | ||
| + | |||
| + | |||
| + | [[File:Distribution of sensors.png|700px|thumb|center|<center>Distribution of sensors across neighbourhoods</center>]] | ||
| + | |||
| + | On an Orange-Blue Diverging scale, neighbourhoods with darker tints of orange are areas that have the least number of recorded radiation values. | ||
| + | |||
| + | [[File:Trends.png|500px|thumb|center]] | ||
| + | |||
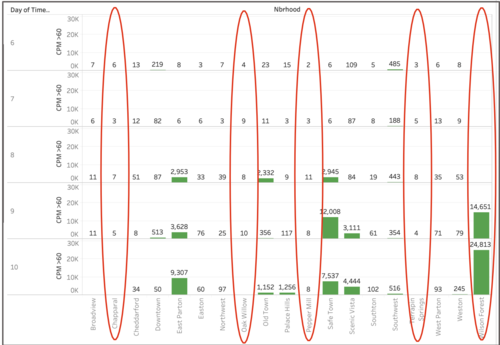
| + | Comparing the two visualisations, we can see a general trend where a lower number of recorded radiation values lead to a lesser number of values recorded being above the base radiation level of 60 cpm. Measurements from Oak Willow, Chapparel, Terrapin Springs and Pepper Mill all indicate normal levels of background radiation in their respective neighbourhoods. | ||
| + | |||
| + | Yet upon comparison with values measured by mobile sensors in neighbourhoods with higher number of recorded radiation values, we can see a big contrast in the changes in radiation levels over the 4 days. Trends gathered from areas with higher number of recorded radiation values suggests radiation leakage on 8th, 9th and 10th of April, which is very much in line with the trend gathered from static sensors. | ||
| + | |||
| + | [[File:Statc trend.png|500px|thumb|center]] | ||
| + | |||
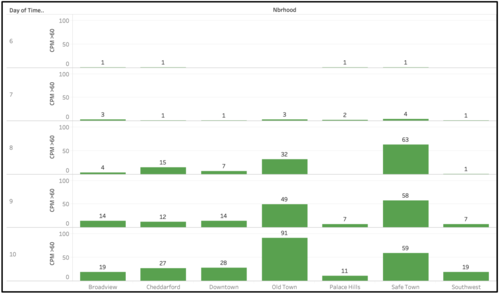
| + | Radiation values in all neighbourhoods gathered from static sensors indicate radiation leakage, as can be seen by increasing number of values with cpm > 60. | ||
| + | |||
| + | === Static or Mobile? === | ||
| + | It is clear that static sensors are more consistent in their measurements of radiation leakage. Setting aside cost considerations, I would recommend the city deploy more static sensors as static sensors can give better measurements of radiation leakage. | ||
| + | |||
| + | Static sensors are important in validating data collecting from mobile sensors. In areas like Wilson Forest, radiation values collected from mobile sensors follow the same trend where the number of radiation values recorded being more than 60 cpm increases from 8 - 10 April. | ||
| + | |||
| + | Yet when we account for location, it seems unlikely that Wilson Forest, being situated comparatively further from the nuclear power plant, will experience such high increases in background radiation levels. | ||
| + | |||
| + | Nevertheless, mobile sensors will be more effective in detecting areas within the neighbourhood with higher concentrations of radiation. However, due to uncertainties with measurements collected by mobile sensors, I would urge city officials to deploy static sensors. | ||
Latest revision as of 18:43, 13 October 2019
This section will answer questions for Mini Case 2
Contents
Question 3
Reliability of sensors
The reliability of the sensors in locating areas of concerns depends on what we are trying to determine. If we are looking to determine if the readings are reliable in helping us determine background radiation levels, then contaminated sensors might give unreliable readings. However, if we are trying to determine areas where radioactive contamination might have spread to, data from contaminated sensors will be able to show us areas that are likely to be contaminated.
The map above shows areas where potentially contaminated cars have travelled to after contamination.
Contaminated cars are a cause for concern because they will spread the contamination to areas where they travel to. Officials should work on identifying these cars and isolate them.
Number of contaminated cars
The estimated number of contaminated cars amount to 9. These cars will be cars in possession of the following sensors:
Of the 9 identified cars, only one (car fitted with sensor 46) has travelled across multiple neighbourhoods. As can be seen by the locality of the sensors, the other 8 sensors have only travelled within Wilson Forest ever since their contamination.
Areas in need of additional monitoring infrastructure
Areas in need of additional sensors are areas identified in Question 2. These areas include:
- Oak Willow
- Chapparel
- Wilson Forest
- Terrapin Springs
- Pepper Mill
More sensors are needed to better measure the radiation values in these neighbourhoods.
On an Orange-Blue Diverging scale, neighbourhoods with darker tints of orange are areas that have the least number of recorded radiation values.
Comparing the two visualisations, we can see a general trend where a lower number of recorded radiation values lead to a lesser number of values recorded being above the base radiation level of 60 cpm. Measurements from Oak Willow, Chapparel, Terrapin Springs and Pepper Mill all indicate normal levels of background radiation in their respective neighbourhoods.
Yet upon comparison with values measured by mobile sensors in neighbourhoods with higher number of recorded radiation values, we can see a big contrast in the changes in radiation levels over the 4 days. Trends gathered from areas with higher number of recorded radiation values suggests radiation leakage on 8th, 9th and 10th of April, which is very much in line with the trend gathered from static sensors.
Radiation values in all neighbourhoods gathered from static sensors indicate radiation leakage, as can be seen by increasing number of values with cpm > 60.
Static or Mobile?
It is clear that static sensors are more consistent in their measurements of radiation leakage. Setting aside cost considerations, I would recommend the city deploy more static sensors as static sensors can give better measurements of radiation leakage.
Static sensors are important in validating data collecting from mobile sensors. In areas like Wilson Forest, radiation values collected from mobile sensors follow the same trend where the number of radiation values recorded being more than 60 cpm increases from 8 - 10 April.
Yet when we account for location, it seems unlikely that Wilson Forest, being situated comparatively further from the nuclear power plant, will experience such high increases in background radiation levels.
Nevertheless, mobile sensors will be more effective in detecting areas within the neighbourhood with higher concentrations of radiation. However, due to uncertainties with measurements collected by mobile sensors, I would urge city officials to deploy static sensors.


