Difference between revisions of "IS428 AY2019-20T1 Assign Foo Yong Long RiskAnalysis"
Ylfoo.2017 (talk | contribs) (/* Which regions of the city have greater uncertainty of radiation measurement? Use visual analytics to explain your rationale. What effects do you see in the sensor readings after the earthquake and other major events? What effect do these events have...) |
Ylfoo.2017 (talk | contribs) |
||
| (15 intermediate revisions by the same user not shown) | |||
| Line 25: | Line 25: | ||
<!-- Header End --> | <!-- Header End --> | ||
<br> | <br> | ||
| + | |||
| + | <br> | ||
| + | |||
| + | <p>Your task, as supported by visual analytics that you apply, is to help St. Himark’s emergency management team combine data from the government-operated stationary monitors with data from citizen-operated mobile sensors to help them better understand conditions in the city and identify likely locations that will require further monitoring, cleanup, or even evacuation. Will data from citizen scientists clarify the situation or make it more uncertain? Use visual analytics to develop responses to the questions below. | ||
== Question 1 == | == Question 1 == | ||
===Visualize radiation measurements over time from both static and mobile sensors to identify areas where radiation over background is detected. Characterize changes over time.=== | ===Visualize radiation measurements over time from both static and mobile sensors to identify areas where radiation over background is detected. Characterize changes over time.=== | ||
---- | ---- | ||
| + | |||
<br> | <br> | ||
<p> | <p> | ||
| Line 65: | Line 70: | ||
===Use visual analytics to represent and analyze uncertainty in the measurement of radiation across the city. Compare uncertainty of the static sensors to the mobile sensors. What anomalies can you see? Are there sensors that are too uncertain to trust?=== | ===Use visual analytics to represent and analyze uncertainty in the measurement of radiation across the city. Compare uncertainty of the static sensors to the mobile sensors. What anomalies can you see? Are there sensors that are too uncertain to trust?=== | ||
---- | ---- | ||
| − | |||
| − | |||
| − | |||
| − | + | ||
| − | |||
| − | |||
| − | |||
| − | |||
| − | |||
| − | |||
| − | |||
[[File:MissingMobile.png|900px|center]] | [[File:MissingMobile.png|900px|center]] | ||
'''Mobile''' | '''Mobile''' | ||
[[File:MissingStatic.png|900px|center]] | [[File:MissingStatic.png|900px|center]] | ||
'''Static''' | '''Static''' | ||
| + | There were missing data for both the Static and Mobile Sensors. | ||
| − | |||
| − | |||
| − | |||
| − | |||
| − | |||
[[File:EarthQuake.png|900px|center]] | [[File:EarthQuake.png|900px|center]] | ||
| Line 97: | Line 88: | ||
Subsequently, there is an increase in radiation levels among radiation levels from 8th April onwards and more sensors stopped functioning. | Subsequently, there is an increase in radiation levels among radiation levels from 8th April onwards and more sensors stopped functioning. | ||
| − | |||
| − | |||
===Which regions of the city have greater uncertainty of radiation measurement? Use visual analytics to explain your rationale. What effects do you see in the sensor readings after the earthquake and other major events? What effect do these events have on uncertainty?=== | ===Which regions of the city have greater uncertainty of radiation measurement? Use visual analytics to explain your rationale. What effects do you see in the sensor readings after the earthquake and other major events? What effect do these events have on uncertainty?=== | ||
---- | ---- | ||
| − | + | ||
| − | + | '''Static Sensors''' | |
| − | + | ||
| + | The values from static sensors are more stable compared to mobile sensors due to the coverage. | ||
| + | |||
| + | '''Limitation: Scope of coverage''' | ||
| + | |||
| + | Static sensors only cover 8 out of 19 areas, missing out on crucial areas such as the southwest region which contain contaminated areas as reported by the mobile sensors. | ||
| + | |||
| + | [[File:StaticUncertainity.png|900px|center]] | ||
| + | |||
| + | Furthermore, sensors 13 and sensor 15 are too abnormal to trust. Despite having reported high radiation levels after 8th April, these sensors remain stagnant with little or no spike despite being only 2.5 and 0.86 miles respectively from the radiator. | ||
| + | |||
| + | |||
| + | '''Mobile Sensors''' | ||
| + | |||
| + | Mobile sensors reported greater fluctuation in results as compared to static sensors, with values ranging from 0 to 1525.However, they cover more areas as compared to static sensors which explains the deviation. However, they too present certain risks and limitations despite being able to cover more areas. | ||
| + | |||
| + | '''Limitation: Scope of coverage''' | ||
| + | |||
| + | [[File:MobileSensorCoverage.png|900px|center]] | ||
| + | |||
| + | As seen on the diagram above, the various counts of mobile sensors are denominated by blue. History Trails and Marks are set and you can see that the mobile sensors are clustered greatly into high activity towns such as Weston, Easton ,Southton , NorthTon and West Parton. The only ventured into the south western areas which contained high radiation values during Friday. With a lack of sample size in these areas, there is greater uncertainty of radiation measurement in these areas as values might be influenced by outliers caused by broken sensors. | ||
| + | |||
| + | '''Limitation: Inconsistency of data''' | ||
| + | |||
| + | [[File:contanimatedcars.png|900px|center]] | ||
| + | |||
| + | Mobile sensors presents greater loss of data compared to static sensors due to a higher chance of wear and tear. Furthermore, since they are stuck onto cars, data connectivity might be loss throughout the journey. | ||
| + | |||
| + | Furthermore, once a car is contaminated, the sensor will only reflect the value of radiation coming from the car and not the surrounding area. This can be seen from the graph above which shows mobile sensors 9,10,20,21,22,24,25,27,28,29 and 45 having lots of missing data or inflated radiation values after the earthquake. | ||
== Question 3 == | == Question 3 == | ||
| Line 112: | Line 129: | ||
<br> | <br> | ||
<p> | <p> | ||
| − | <div style="background: #364558; padding: 15px; font-weight: bold; line-height: 0.3em; text-indent: 0px;font-size:20px"><font face="Arial" color=#fbfcfd><center>''' | + | <div style="background: #364558; padding: 15px; font-weight: bold; line-height: 0.3em; text-indent: 0px;font-size:20px"><font face="Arial" color=#fbfcfd><center>'''Potential Locations of contamination'''</center></font></div> |
{| class="wikitable" style="background-color:#FFFFFF;" width="100%" | {| class="wikitable" style="background-color:#FFFFFF;" width="100%" | ||
|- | |- | ||
| − | ! style="font-weight: bold;background: #536a87;color:#fbfcfd;width: 10%;" | | + | ! style="font-weight: bold;background: #536a87;color:#fbfcfd;width: 10%;" | No. |
! style="font-weight: bold;background: #536a87;color:#fbfcfd;width: 90%;" | Description | ! style="font-weight: bold;background: #536a87;color:#fbfcfd;width: 90%;" | Description | ||
|- | |- | ||
| Line 122: | Line 139: | ||
1 | 1 | ||
|| | || | ||
| − | |||
| − | |||
| − | + | After viewing the static sensor data, the only spikes that went above 100 happened in five locations, which are Jade Bridge, Old Town, Safe Town, DownTown and Broadview. | |
| + | |||
| + | [[File:Spike_100Static.png| 900px |center]] | ||
| + | |||
| + | For better analysis, I have grouped together mobile sensors that have a trail of high radiation values within the five days as shown below. | ||
| + | |||
| + | [[File:MobileSensorsHighgroup.png| 900px |center]] | ||
| + | |} | ||
| + | |||
| + | <br> | ||
| + | <p> | ||
| + | <div style="background: #364558; padding: 15px; font-weight: bold; line-height: 0.3em; text-indent: 0px;font-size:20px"><font face="Arial" color=#fbfcfd><center>'''Tracking car movements'''</center></font></div> | ||
| + | |||
| + | To better analyze potential locations of contamination, I would plot the coordinates of these group of mobile sensors and analyze their travel routes during the 5 days. | ||
| + | |||
| + | [[File:Mobile20_49.png| 600px |center]] | ||
| + | |||
| + | [[File:Mobile9_10.png| 600px |center]] | ||
| + | |||
| + | {| class="wikitable" style="background-color:#FFFFFF;" width="100%" | ||
| + | |- | ||
| + | ! style="font-weight: bold;background: #536a87;color:#fbfcfd;width: 10%;" | No. | ||
| + | ! style="font-weight: bold;background: #536a87;color:#fbfcfd;width: 90%;" | Description | ||
|- | |- | ||
| | | | ||
2 | 2 | ||
|| | || | ||
| + | After analyzing the route taken by the mobile sensors, I can confidently assure that there is contamination at Old Town, Jade Bridge, Safe Town, and Scenic Vista. For Mobile Sensors,20,21,22,24,25,27,28,29 and 45, their radiation value was low until they hit Scenic Vista and Jade Bridge, where their radiation value spike. | ||
| − | + | For Mobile Sensors 9 and 10, their radiation count only picked up once they were close to the nuclear plant and when they were at Jade Bridge. If sensors are working all right, despite being really close to the nuclear plant, the cars are not contaminated as they show no signs of high radiations values at other cities. | |
| + | |} | ||
| − | " | + | <br> |
| + | <p> | ||
| + | <div style="background: #364558; padding: 15px; font-weight: bold; line-height: 0.3em; text-indent: 0px;font-size:20px"><font face="Arial" color=#fbfcfd><center>'''End State'''</center></font></div> | ||
| − | " | + | ===Estimate how many cars may have been contaminated when coolant leaked from the Always Safe plant. Use visual analysis of radiation measurements to determine if any have left the area.=== |
| + | ---- | ||
| + | <br> | ||
| + | <p> | ||
| + | <div style="background: #364558; padding: 15px; font-weight: bold; line-height: 0.3em; text-indent: 0px;font-size:20px"><font face="Arial" color=#fbfcfd><center>'''Possibly Contaminated Cars'''</center></font></div> | ||
| − | " | + | [[File:EndState.png| 900px |center]] |
| + | {| class="wikitable" style="background-color:#FFFFFF;" width="100%" | ||
| + | |- | ||
| + | ! style="font-weight: bold;background: #536a87;color:#fbfcfd;width: 10%;" | No. | ||
| + | ! style="font-weight: bold;background: #536a87;color:#fbfcfd;width: 90%;" | Description | ||
| + | |- | ||
| + | | | ||
| + | 3 | ||
| + | || | ||
| + | On April 10 at 11 pm, there were only two cars left out of the possible contaminated cars(Sensor ID 9 & 10). The rest of the cars have exited via Wilson Forest Highway from Scenic Vista. | ||
| + | |- | ||
| + | | | ||
| + | 4 | ||
| + | || | ||
| + | Sensor 20 arrived at Scenic Vista on April 9, it got a spike in radiation levels at about 3pm to a level of 184. | ||
| + | |- | ||
| + | | | ||
| + | 5 | ||
| + | || | ||
| + | On 9th April, Sensor 21,22,25,28,29 and 45 connections were offline since morning about 6am-8am but when turned back on about 6-8pm, their radiation count increased from safe levels to danger levels ranging about 1500cpm. | ||
| − | + | For Sensor 24, it left Scenic Vista via Wilson Forest Highway with radiation levels of 121 at 10 am and came back from another city via Wilson forest Highway with radiation levels of 195. | |
| − | + | For Sensor 27, it returned to Scenic Vista at 7 pm with a healthy radiation value of 31. However, its radiation level increased from 31 to 1335 within an hour being at Scenic Vista. | |
| + | These cars posed a high risk of contamination as they were present at Scenic Vista during the radiation outbreak. The government should identify these vehicles and issue a warning to neighbouring cities nearby St.Himark. | ||
| − | + | |} | |
| + | ===Indicated where you would deploy more sensors to improve radiation monitoring in the city. Would you recommend more static sensors or more mobile sensors or both? Use your visualization of radiation measurement uncertainty to justify your recommendation.=== | ||
| + | ---- | ||
| + | <br> | ||
| + | <p> | ||
| + | <div style="background: #364558; padding: 15px; font-weight: bold; line-height: 0.3em; text-indent: 0px;font-size:20px"><font face="Arial" color=#fbfcfd><center>'''Sensor Deployment Recommendation'''</center></font></div> | ||
| + | |||
| + | |||
| + | {| class="wikitable" style="background-color:#FFFFFF;" width="100%" | ||
| + | |- | ||
| + | ! style="font-weight: bold;background: #536a87;color:#fbfcfd;width: 10%;" | No. | ||
| + | ! style="font-weight: bold;background: #536a87;color:#fbfcfd;width: 90%;" | Description | ||
|- | |- | ||
| | | | ||
| − | + | 6 | |
|| | || | ||
| − | [[File: | + | [[File:redeploy.png| 900px |center]] |
| − | |||
| − | |||
| − | + | Sensor 13 and 15, is positioned within 2 miles of the nuclear plant, was crucial in spotting any possibility of a radiation leak. However, during the course of the simulation, it failed to detect any possible radiation threat, unlike the other sensors. Close radiation exposure might have caused damage to the sensitivity of the sensors. Furthermore, there is a possibility of contaminated cars leaving St.Himark and returning. I will reposition the existing 9 sensors to cover entrances to the city via the bridges and towns currently undergoing sewer maintenance as radiation might spread through the sewers. This position will help authorities manage and contain the situation. | |
| + | |||
| + | To ensure that the northwest region is covered, I will deploy two more sensors covering scenic vista and Wilson highway. | ||
|- | |- | ||
| | | | ||
| − | + | 7 | |
|| | || | ||
| − | |||
| − | + | Besides static sensors, I will add in more mobile sensors to ensure a wider area coverage. To ensure that the northwest region is covered throughout, I will recommend the government to target based on travel routes and provide the sensors to citizens that frequent Scenic Vista or Wilson Forest. | |
|} | |} | ||
Latest revision as of 20:16, 13 October 2019
Your task, as supported by visual analytics that you apply, is to help St. Himark’s emergency management team combine data from the government-operated stationary monitors with data from citizen-operated mobile sensors to help them better understand conditions in the city and identify likely locations that will require further monitoring, cleanup, or even evacuation. Will data from citizen scientists clarify the situation or make it more uncertain? Use visual analytics to develop responses to the questions below.
Contents
- 1 Question 1
- 2 Question 2
- 2.1 Use visual analytics to represent and analyze uncertainty in the measurement of radiation across the city. Compare uncertainty of the static sensors to the mobile sensors. What anomalies can you see? Are there sensors that are too uncertain to trust?
- 2.2 Which regions of the city have greater uncertainty of radiation measurement? Use visual analytics to explain your rationale. What effects do you see in the sensor readings after the earthquake and other major events? What effect do these events have on uncertainty?
- 3 Question 3
- 3.1 Given the uncertainty you observed in question 2, are the radiation measurements reliable enough to locate areas of concern? Highlight potential locations of contamination, including the locations of contaminated cars. Should St. Himark officials be worried about contaminated cars moving around the city?
- 3.2 Estimate how many cars may have been contaminated when coolant leaked from the Always Safe plant. Use visual analysis of radiation measurements to determine if any have left the area.
- 3.3 Indicated where you would deploy more sensors to improve radiation monitoring in the city. Would you recommend more static sensors or more mobile sensors or both? Use your visualization of radiation measurement uncertainty to justify your recommendation.
Question 1
Visualize radiation measurements over time from both static and mobile sensors to identify areas where radiation over background is detected. Characterize changes over time.
| Step | Description |
|---|---|
|
1 |
Mobile Sensors |
|
2 |
Static Sensors |
|
3 |
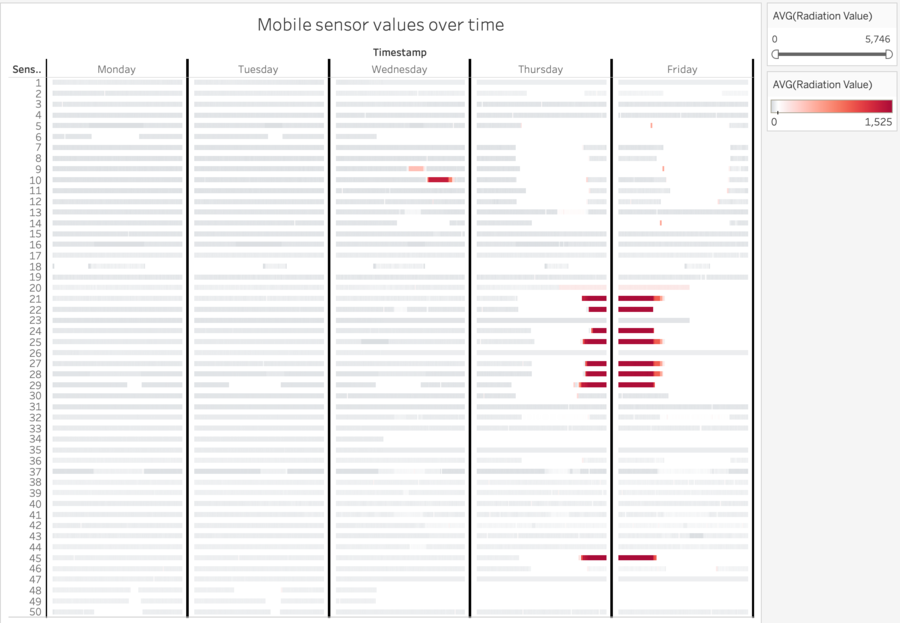
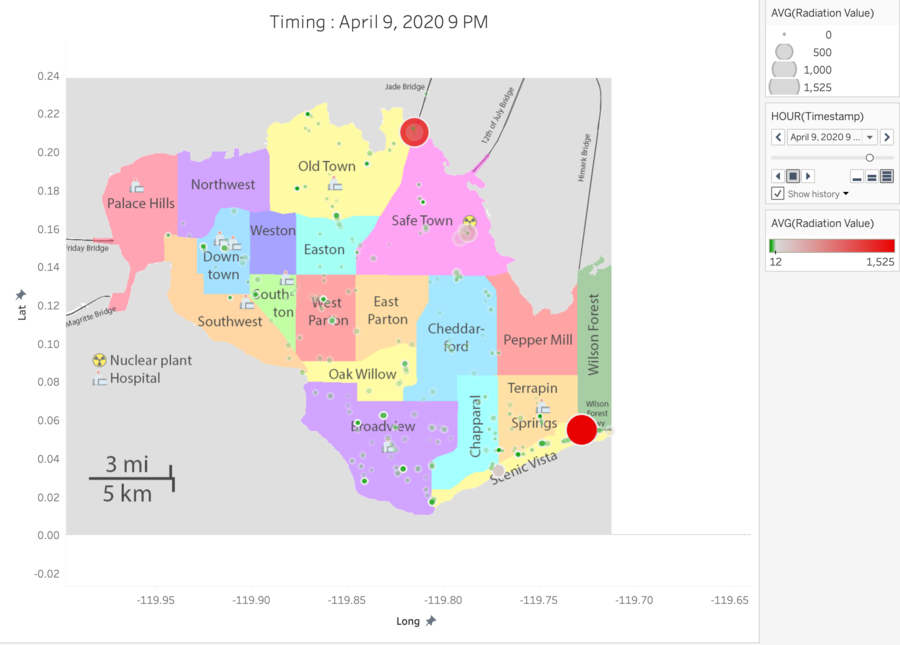
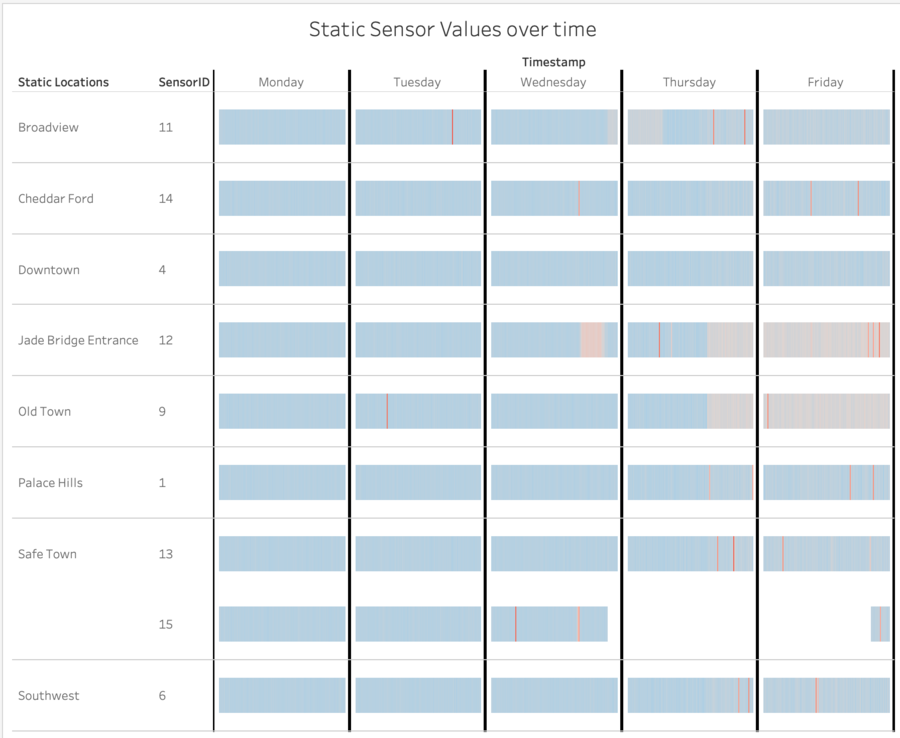
For the visualization of sensors over time, a Gantt chart view was created to analyze the values of radiation of both sensors. In general, places of concern include Old Town, Jade Bridge, and the southeast region which include Terrapin Springs, Wilson Forest and Scenic Vista. The time pills are set to continuous with "minutes" as the variable as the values are measured in counts per minute. The readings from mobile sensors support Static Sensors, which shows a spike in radiation on areas like Old Town, Jade Bridge, and the southeast region. |
Question 2
Use visual analytics to represent and analyze uncertainty in the measurement of radiation across the city. Compare uncertainty of the static sensors to the mobile sensors. What anomalies can you see? Are there sensors that are too uncertain to trust?
Mobile
Static
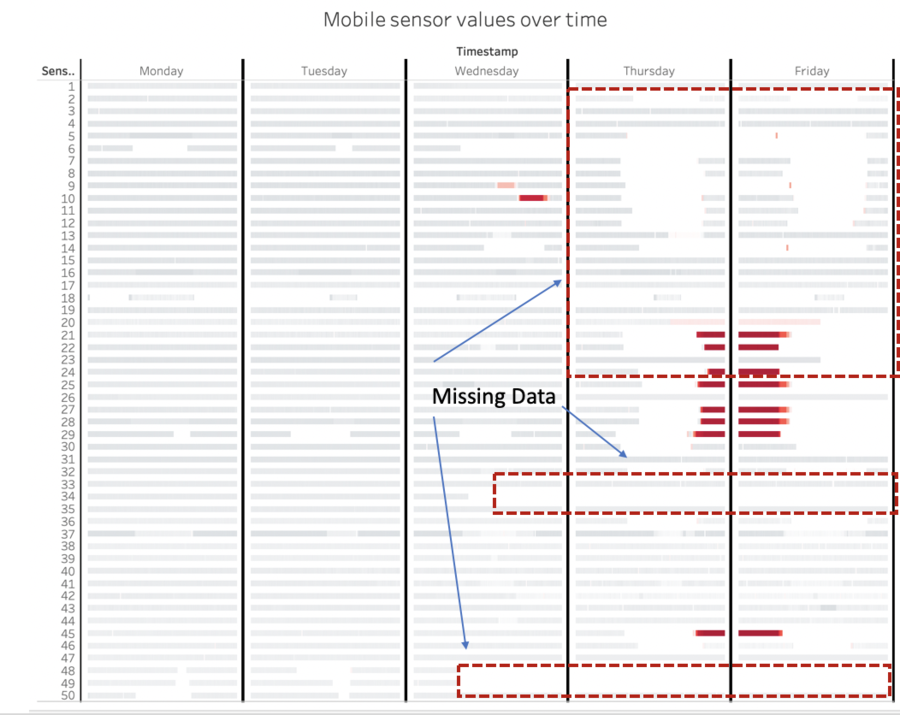
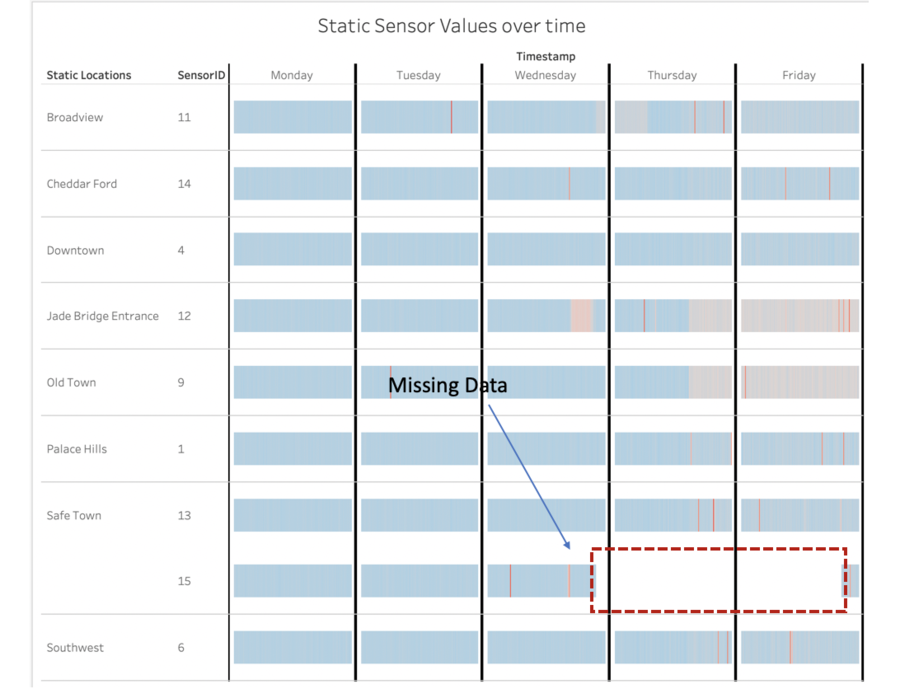
There were missing data for both the Static and Mobile Sensors.
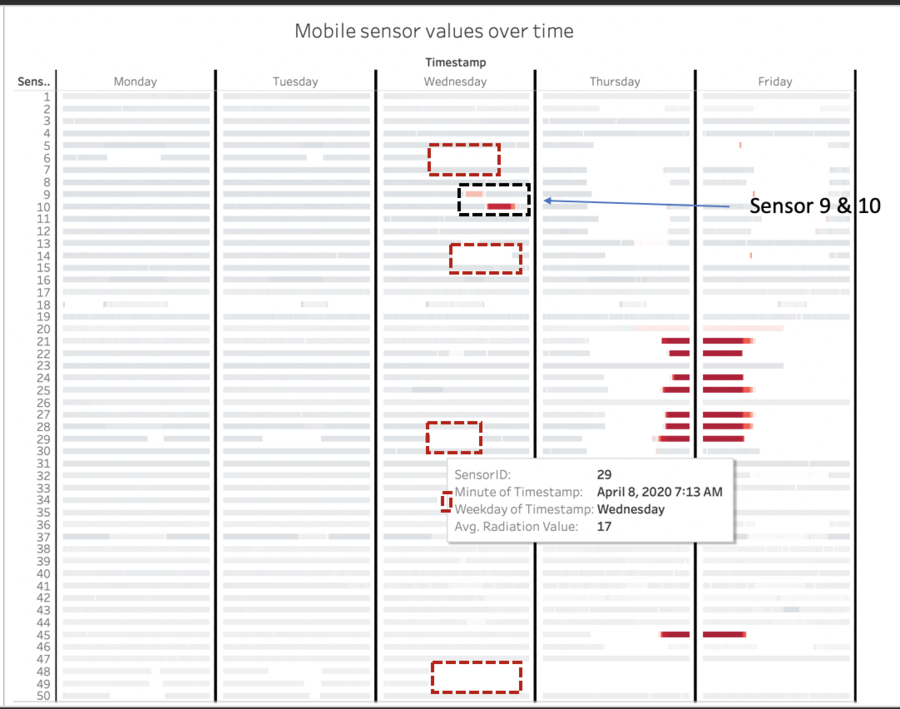
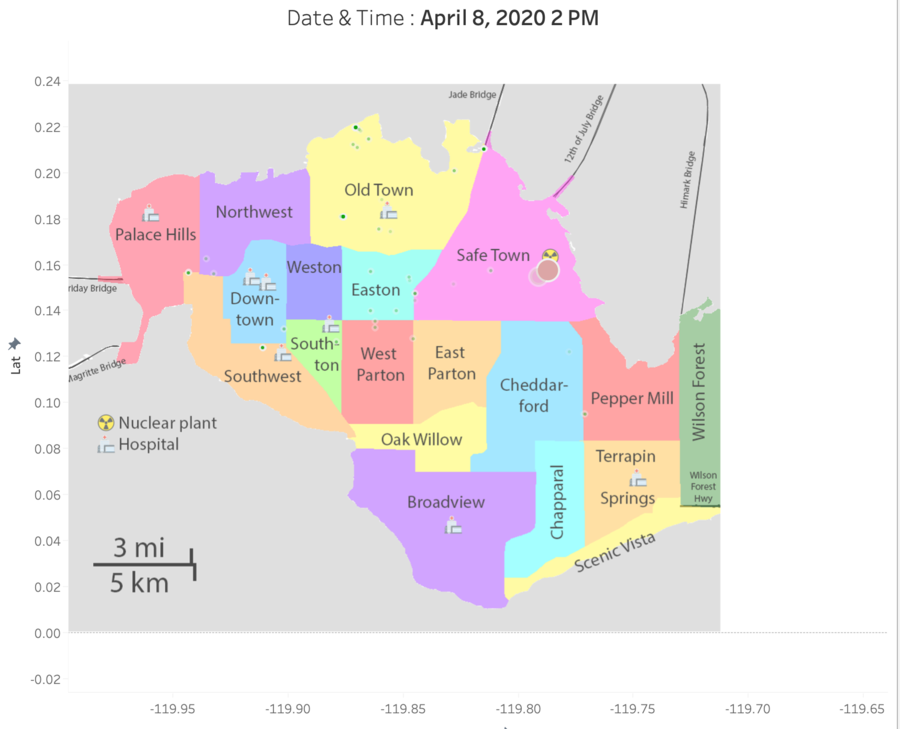
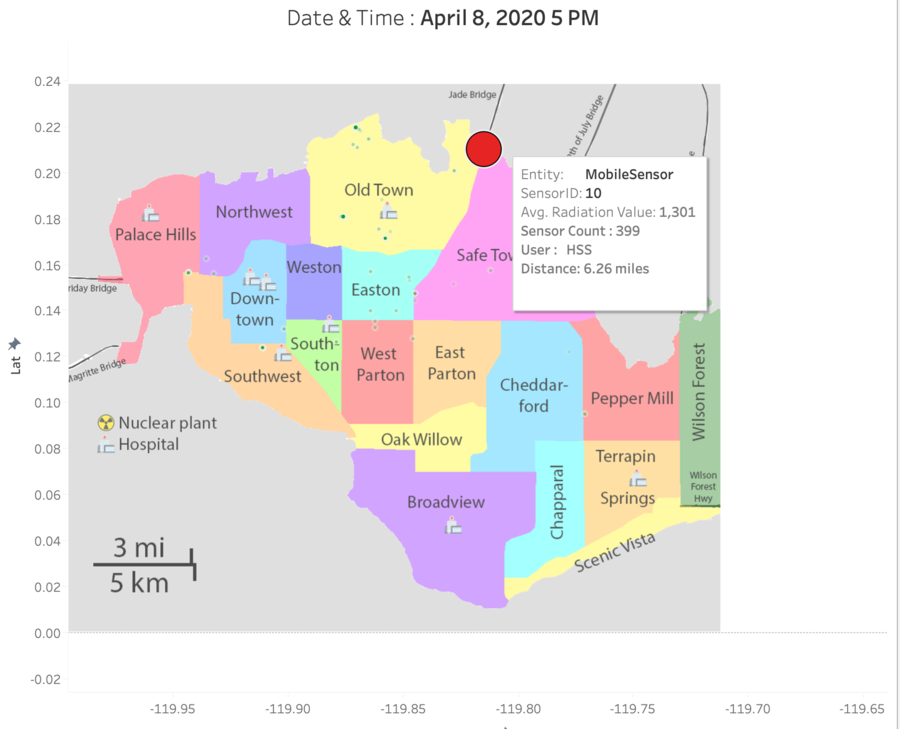
The earthquake might have happened around 7.10am on 8th April. A bunch of mobile sensors lost connectivity on the morning of 8th April around 7.16 am - 7.30 am. This might have caused a radiation leak at the nuclear plant. Shortly afterward from 1.26 pm to 4.27 pm, Mobile Sensor 9 which is driving beside the nuclear plant (Distance from plant = 0.62 miles), detected an increase in radiation level to 1301. At 5 pm, there was a surge in radiation levels at the entrance of the Jade bridge (Distance from plant = 6.26 miles).
Subsequently, there is an increase in radiation levels among radiation levels from 8th April onwards and more sensors stopped functioning.
Which regions of the city have greater uncertainty of radiation measurement? Use visual analytics to explain your rationale. What effects do you see in the sensor readings after the earthquake and other major events? What effect do these events have on uncertainty?
Static Sensors
The values from static sensors are more stable compared to mobile sensors due to the coverage.
Limitation: Scope of coverage
Static sensors only cover 8 out of 19 areas, missing out on crucial areas such as the southwest region which contain contaminated areas as reported by the mobile sensors.
Furthermore, sensors 13 and sensor 15 are too abnormal to trust. Despite having reported high radiation levels after 8th April, these sensors remain stagnant with little or no spike despite being only 2.5 and 0.86 miles respectively from the radiator.
Mobile Sensors
Mobile sensors reported greater fluctuation in results as compared to static sensors, with values ranging from 0 to 1525.However, they cover more areas as compared to static sensors which explains the deviation. However, they too present certain risks and limitations despite being able to cover more areas.
Limitation: Scope of coverage
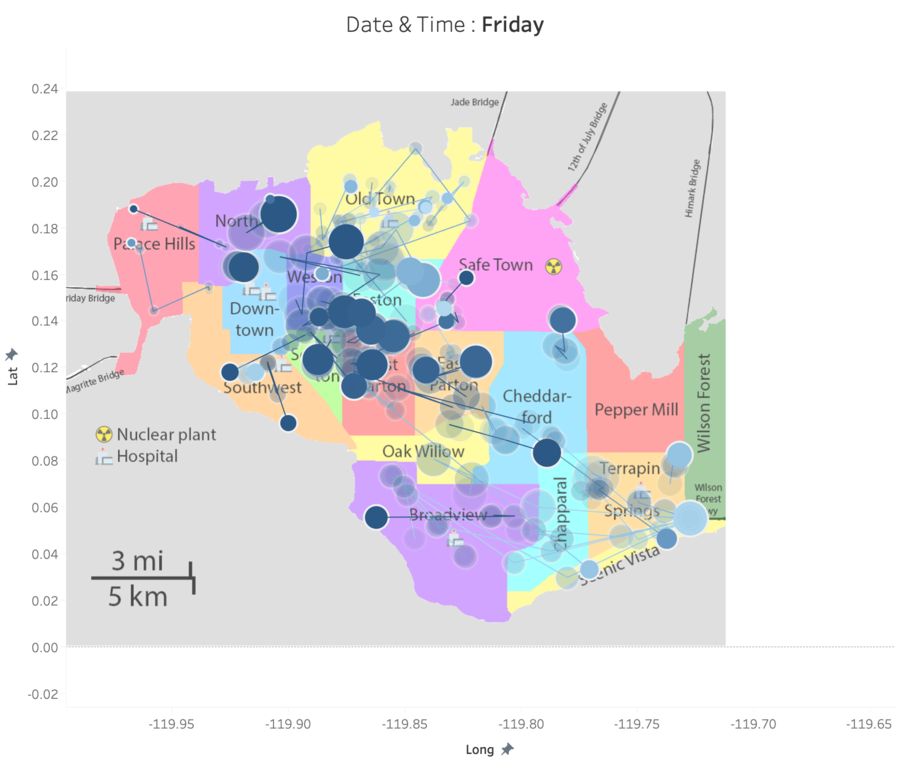
As seen on the diagram above, the various counts of mobile sensors are denominated by blue. History Trails and Marks are set and you can see that the mobile sensors are clustered greatly into high activity towns such as Weston, Easton ,Southton , NorthTon and West Parton. The only ventured into the south western areas which contained high radiation values during Friday. With a lack of sample size in these areas, there is greater uncertainty of radiation measurement in these areas as values might be influenced by outliers caused by broken sensors.
Limitation: Inconsistency of data
Mobile sensors presents greater loss of data compared to static sensors due to a higher chance of wear and tear. Furthermore, since they are stuck onto cars, data connectivity might be loss throughout the journey.
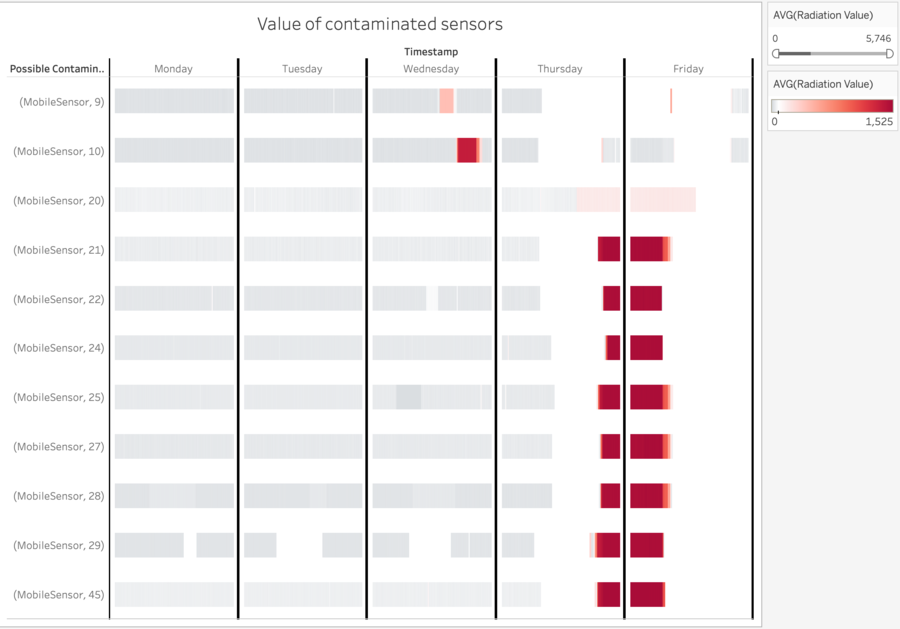
Furthermore, once a car is contaminated, the sensor will only reflect the value of radiation coming from the car and not the surrounding area. This can be seen from the graph above which shows mobile sensors 9,10,20,21,22,24,25,27,28,29 and 45 having lots of missing data or inflated radiation values after the earthquake.
Question 3
Given the uncertainty you observed in question 2, are the radiation measurements reliable enough to locate areas of concern? Highlight potential locations of contamination, including the locations of contaminated cars. Should St. Himark officials be worried about contaminated cars moving around the city?
| No. | Description |
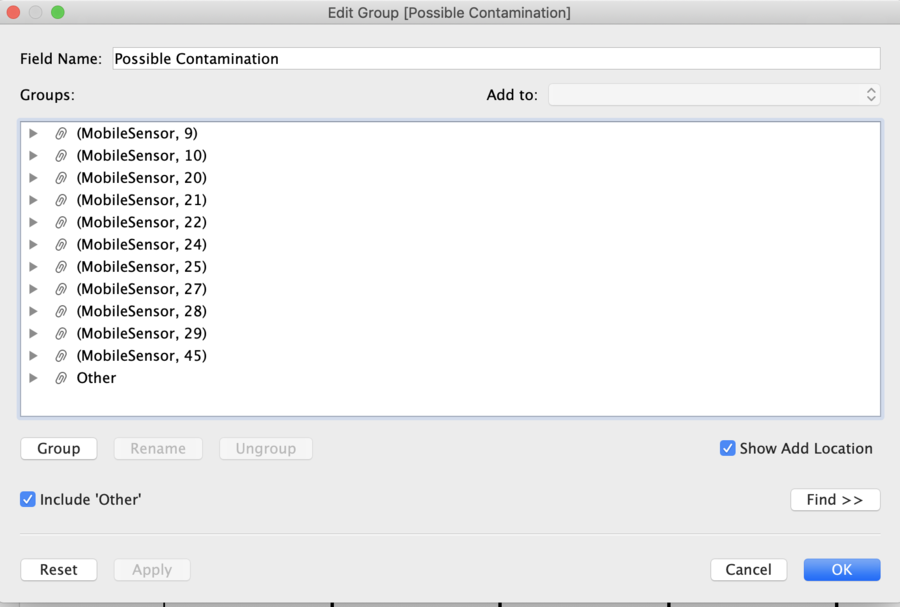
|---|---|
|
1 |
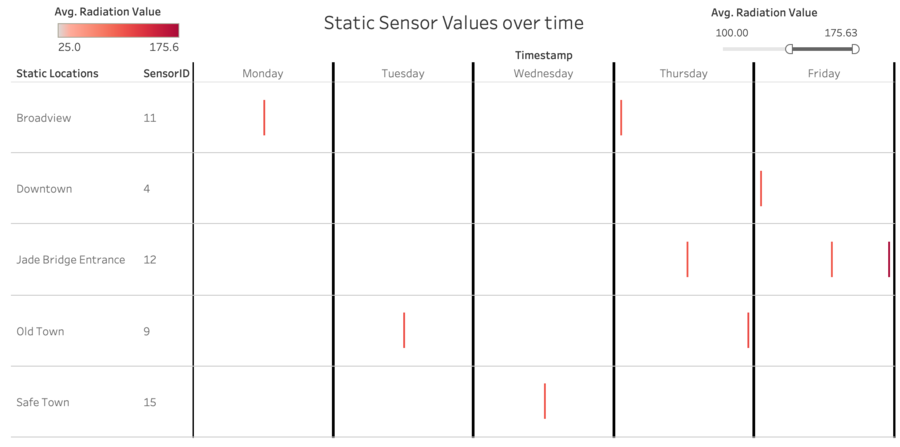
After viewing the static sensor data, the only spikes that went above 100 happened in five locations, which are Jade Bridge, Old Town, Safe Town, DownTown and Broadview. For better analysis, I have grouped together mobile sensors that have a trail of high radiation values within the five days as shown below. |
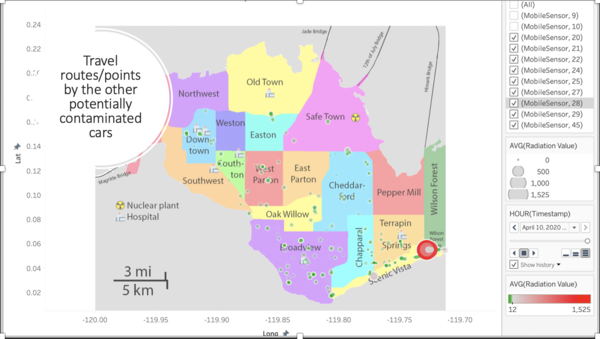
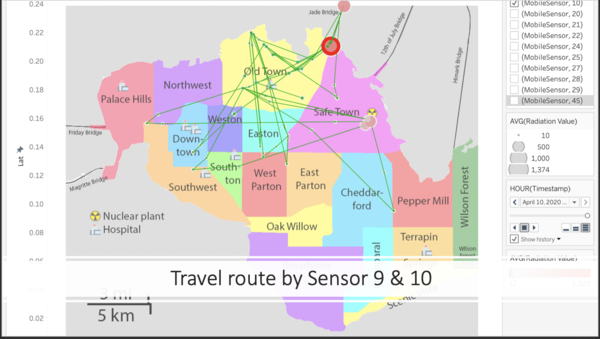
To better analyze potential locations of contamination, I would plot the coordinates of these group of mobile sensors and analyze their travel routes during the 5 days.
| No. | Description |
|---|---|
|
2 |
After analyzing the route taken by the mobile sensors, I can confidently assure that there is contamination at Old Town, Jade Bridge, Safe Town, and Scenic Vista. For Mobile Sensors,20,21,22,24,25,27,28,29 and 45, their radiation value was low until they hit Scenic Vista and Jade Bridge, where their radiation value spike. For Mobile Sensors 9 and 10, their radiation count only picked up once they were close to the nuclear plant and when they were at Jade Bridge. If sensors are working all right, despite being really close to the nuclear plant, the cars are not contaminated as they show no signs of high radiations values at other cities. |
Estimate how many cars may have been contaminated when coolant leaked from the Always Safe plant. Use visual analysis of radiation measurements to determine if any have left the area.
| No. | Description |
|---|---|
|
3 |
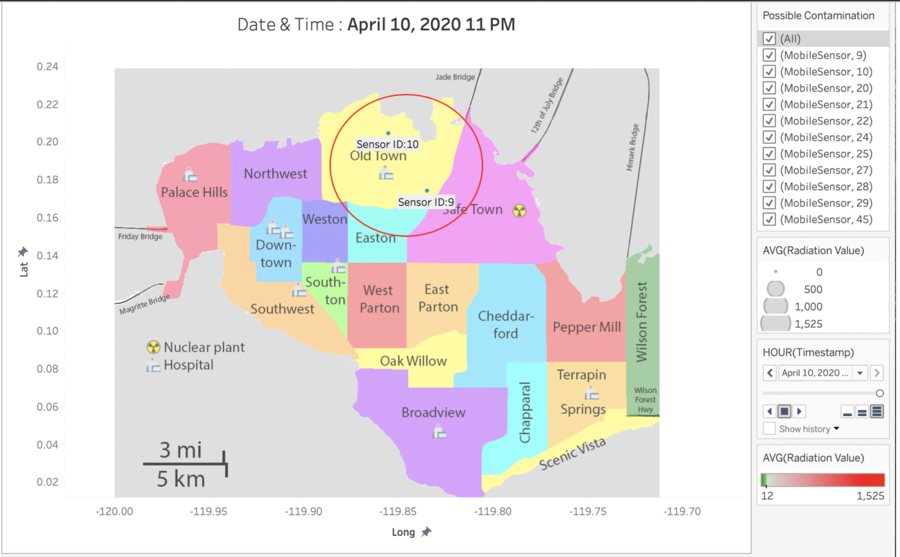
On April 10 at 11 pm, there were only two cars left out of the possible contaminated cars(Sensor ID 9 & 10). The rest of the cars have exited via Wilson Forest Highway from Scenic Vista. |
|
4 |
Sensor 20 arrived at Scenic Vista on April 9, it got a spike in radiation levels at about 3pm to a level of 184. |
|
5 |
On 9th April, Sensor 21,22,25,28,29 and 45 connections were offline since morning about 6am-8am but when turned back on about 6-8pm, their radiation count increased from safe levels to danger levels ranging about 1500cpm. For Sensor 24, it left Scenic Vista via Wilson Forest Highway with radiation levels of 121 at 10 am and came back from another city via Wilson forest Highway with radiation levels of 195. For Sensor 27, it returned to Scenic Vista at 7 pm with a healthy radiation value of 31. However, its radiation level increased from 31 to 1335 within an hour being at Scenic Vista. These cars posed a high risk of contamination as they were present at Scenic Vista during the radiation outbreak. The government should identify these vehicles and issue a warning to neighbouring cities nearby St.Himark. |
Indicated where you would deploy more sensors to improve radiation monitoring in the city. Would you recommend more static sensors or more mobile sensors or both? Use your visualization of radiation measurement uncertainty to justify your recommendation.
| No. | Description |
|---|---|
|
6 |
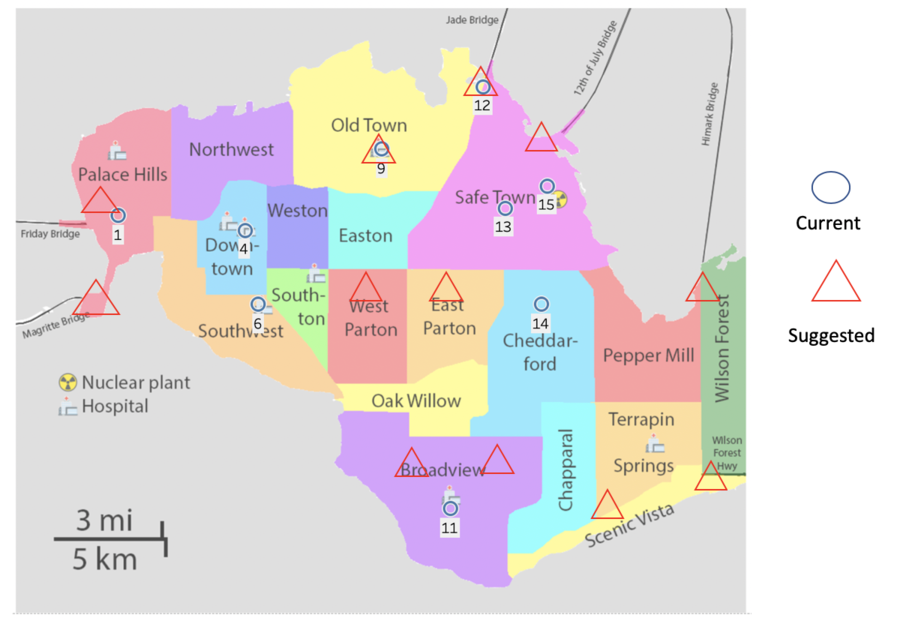
Sensor 13 and 15, is positioned within 2 miles of the nuclear plant, was crucial in spotting any possibility of a radiation leak. However, during the course of the simulation, it failed to detect any possible radiation threat, unlike the other sensors. Close radiation exposure might have caused damage to the sensitivity of the sensors. Furthermore, there is a possibility of contaminated cars leaving St.Himark and returning. I will reposition the existing 9 sensors to cover entrances to the city via the bridges and towns currently undergoing sewer maintenance as radiation might spread through the sewers. This position will help authorities manage and contain the situation. To ensure that the northwest region is covered, I will deploy two more sensors covering scenic vista and Wilson highway. |
|
7 |
Besides static sensors, I will add in more mobile sensors to ensure a wider area coverage. To ensure that the northwest region is covered throughout, I will recommend the government to target based on travel routes and provide the sensors to citizens that frequent Scenic Vista or Wilson Forest. |
