Difference between revisions of "IS428 AY2019-20T1 Assign Foo Yong Long RiskAnalysis"
Ylfoo.2017 (talk | contribs) |
Ylfoo.2017 (talk | contribs) |
||
| Line 71: | Line 71: | ||
---- | ---- | ||
<br> | <br> | ||
| − | |||
| − | |||
| − | |||
| − | |||
{| class="wikitable" style="background-color:#FFFFFF;" width="100%" | {| class="wikitable" style="background-color:#FFFFFF;" width="100%" | ||
|- | |- | ||
| − | ! style="font-weight: bold;background: #536a87;color:#fbfcfd;width: 10%;" | | + | ! style="font-weight: bold;background: #536a87;color:#fbfcfd;width: 10%;" | Step |
! style="font-weight: bold;background: #536a87;color:#fbfcfd;width: 90%;" | Description | ! style="font-weight: bold;background: #536a87;color:#fbfcfd;width: 90%;" | Description | ||
|- | |- | ||
| Line 83: | Line 79: | ||
1 | 1 | ||
|| | || | ||
| − | Static | + | [[File:MissingMobile.png|900px|center]] |
| + | '''Mobile''' | ||
| + | [[File:MissingStatic.png|900px|center]] | ||
| + | '''Static''' | ||
| + | |||
| + | There were missing data for both the Static and Mobile Sensors. | ||
| + | |||
|- | |- | ||
| | | | ||
2 | 2 | ||
|| | || | ||
| − | |||
| − | |||
| − | + | [[File:EarthQuake.png|900px|center]] | |
| − | + | [[File:Sensor9Pickup.png|900px|center]] | |
| − | + | [[File:Sensor10Pickup.png|900px|center]] | |
| − | + | The earthquake might have happened around 7.10am on 8th April. A bunch of mobile sensors lost connectivity on the morning of 8th April around 7.16 am - 7.30 am. This might have caused a radiation leak at the nuclear plant. Shortly afterward from 1.26 pm to 4.27 pm, Mobile Sensor 9 which is driving beside the nuclear plant (Distance from plant = 0.62 miles), detected an increase in radiation level to 1301. At 5 pm, there was a surge in radiation levels at the entrance of the Jade bridge (Distance from plant = 6.26 miles). | |
| − | |||
| − | |||
| − | |||
| − | |||
| − | |||
| − | |||
| − | |||
| − | |||
| − | |||
| − | |||
| − | |||
| − | |||
| − | |||
| − | |||
| − | |||
| − | + | Subsequently, there is an increase in radiation levels among radiation levels from 8th April onwards and more sensors stopped functioning. | |
| − | |||
| − | |||
| − | |||
| − | |||
| − | |||
| − | |||
| − | |||
|- | |- | ||
| − | + | <br> | |
| − | |||
| − | |||
| − | |||
| − | |||
| − | |||
| − | |||
| − | |||
| − | |||
| − | |||
| − | |||
| − | + | ===Which regions of the city have greater uncertainty of radiation measurement? Use visual analytics to explain your rationale. What effects do you see in the sensor readings after the earthquake and other major events? What effect do these events have on uncertainty?=== | |
| − | + | ---- | |
| − | |||
| − | |||
| − | |||
| − | |||
| − | |||
| − | |||
| − | |||
| − | |||
| − | |||
| − | |||
| − | |||
| − | |||
| − | |||
| − | |||
| − | |||
| − | |||
| − | |||
| − | |||
| − | |||
== Question 3 == | == Question 3 == | ||
Revision as of 17:49, 13 October 2019
Your task, as supported by visual analytics that you apply, is to help St. Himark’s emergency management team combine data from the government-operated stationary monitors with data from citizen-operated mobile sensors to help them better understand conditions in the city and identify likely locations that will require further monitoring, cleanup, or even evacuation. Will data from citizen scientists clarify the situation or make it more uncertain? Use visual analytics to develop responses to the questions below.
Contents
- 1 Question 1
- 2 Question 2
- 2.1 Use visual analytics to represent and analyze uncertainty in the measurement of radiation across the city. Compare uncertainty of the static sensors to the mobile sensors. What anomalies can you see? Are there sensors that are too uncertain to trust?
- 2.2 Which regions of the city have greater uncertainty of radiation measurement? Use visual analytics to explain your rationale. What effects do you see in the sensor readings after the earthquake and other major events? What effect do these events have on uncertainty?
- 3 Question 3
- 3.1 Given the uncertainty you observed in question 2, are the radiation measurements reliable enough to locate areas of concern? Highlight potential locations of contamination, including the locations of contaminated cars. Should St. Himark officials be worried about contaminated cars moving around the city?
- 3.2 Estimate how many cars may have been contaminated when coolant leaked from the Always Safe plant. Use visual analysis of radiation measurements to determine if any have left the area.
- 3.3 Indicated where you would deploy more sensors to improve radiation monitoring in the city. Would you recommend more static sensors or more mobile sensors or both? Use your visualization of radiation measurement uncertainty to justify your recommendation.
Question 1
Visualize radiation measurements over time from both static and mobile sensors to identify areas where radiation over background is detected. Characterize changes over time.
| Step | Description |
|---|---|
|
1 |
Mobile Sensors |
|
2 |
Static Sensors |
|
3 |
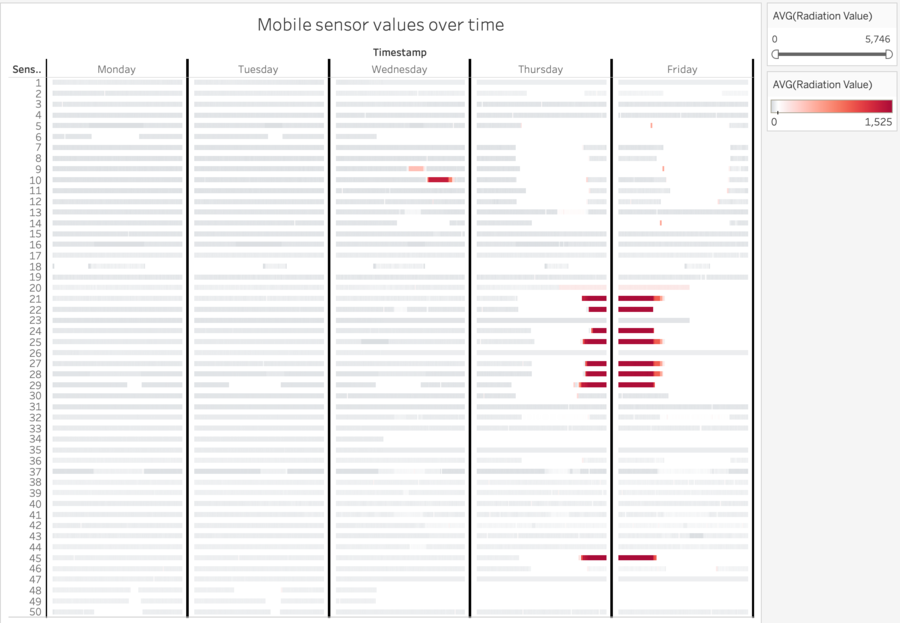
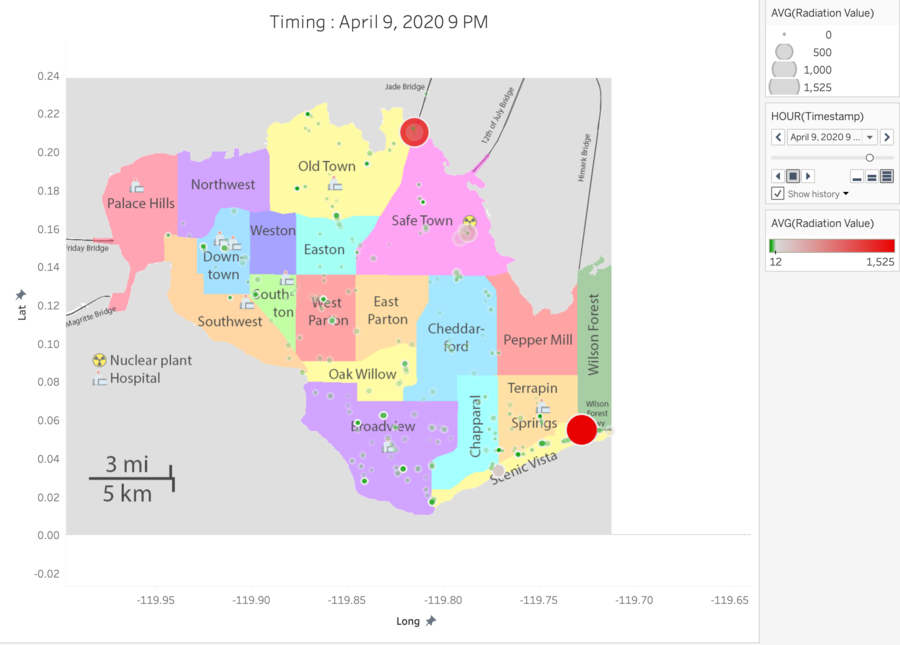
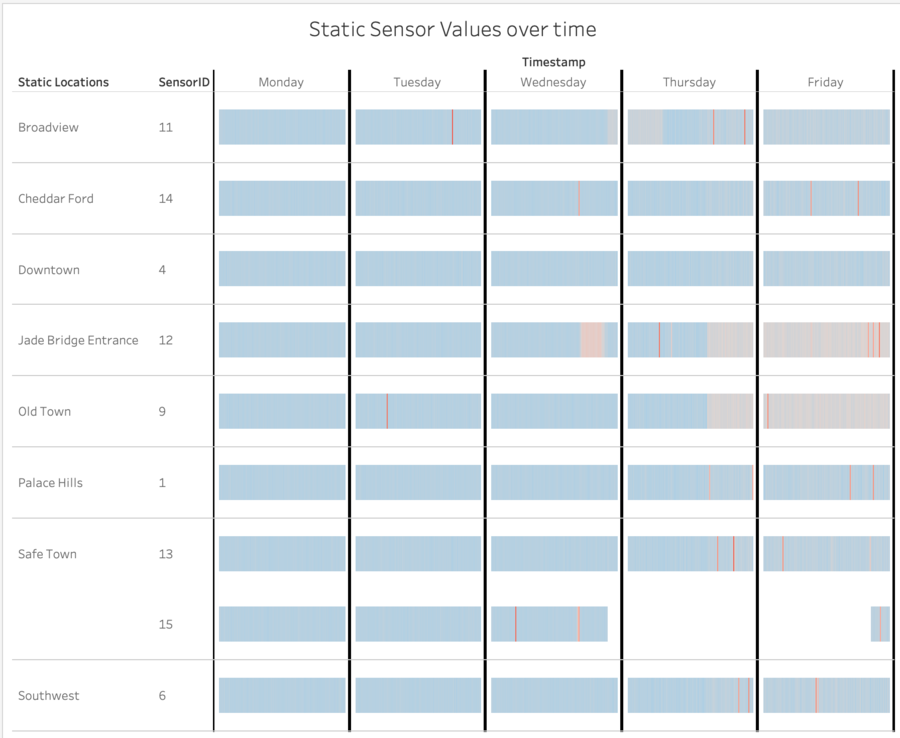
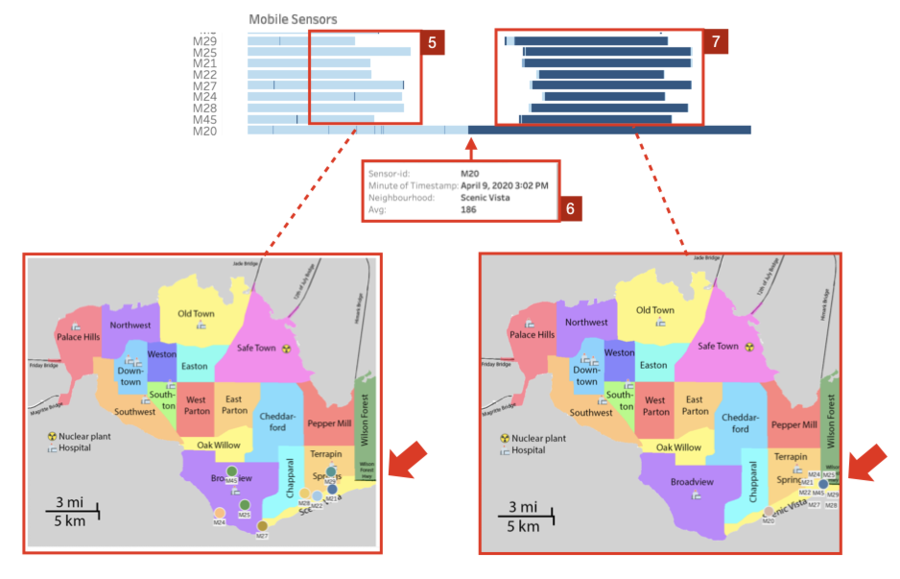
For the visualization of sensors over time, a Gantt chart view was created to analyze the values of radiation of both sensors. In general, places of concern include Old Town, Jade Bridge, and the southeast region which include Terrapin Springs, Wilson Forest and Scenic Vista. The time pills are set to continuous with "minutes" as the variable as the values are measured in counts per minute. The readings from mobile sensors support Static Sensors, which shows a spike in radiation on areas like Old Town, Jade Bridge, and the southeast region. |
Question 2
Use visual analytics to represent and analyze uncertainty in the measurement of radiation across the city. Compare uncertainty of the static sensors to the mobile sensors. What anomalies can you see? Are there sensors that are too uncertain to trust?
Which regions of the city have greater uncertainty of radiation measurement? Use visual analytics to explain your rationale. What effects do you see in the sensor readings after the earthquake and other major events? What effect do these events have on uncertainty?
Question 3
Given the uncertainty you observed in question 2, are the radiation measurements reliable enough to locate areas of concern? Highlight potential locations of contamination, including the locations of contaminated cars. Should St. Himark officials be worried about contaminated cars moving around the city?
| Step | Description |
|---|---|
|
1 |
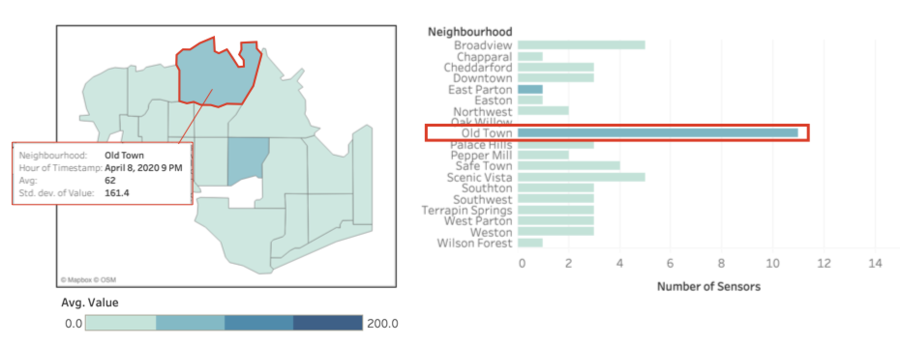
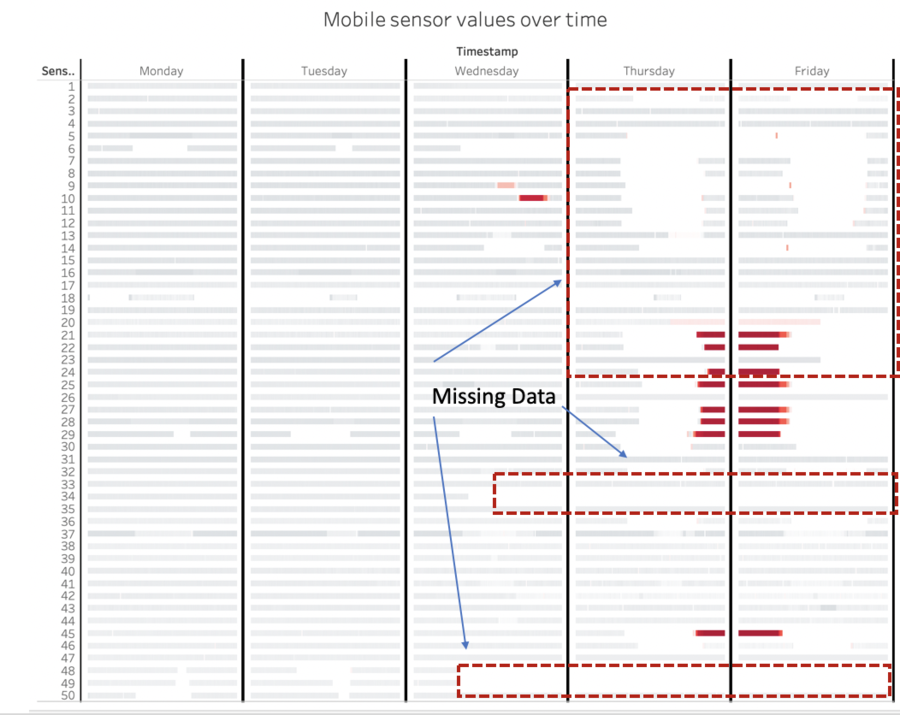
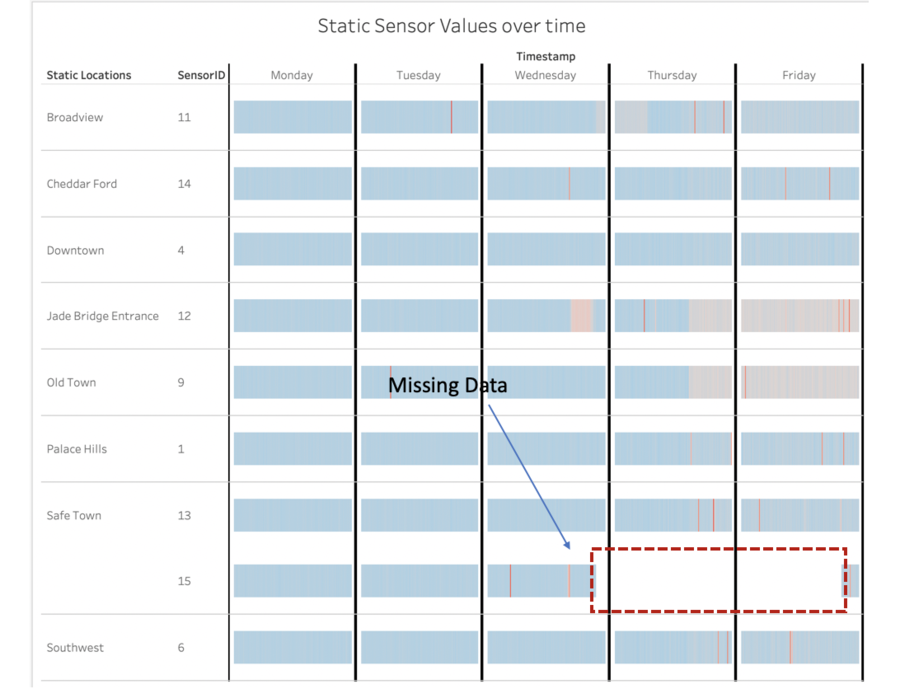
Mobile Static There were missing data for both the Static and Mobile Sensors. |
|
2 |
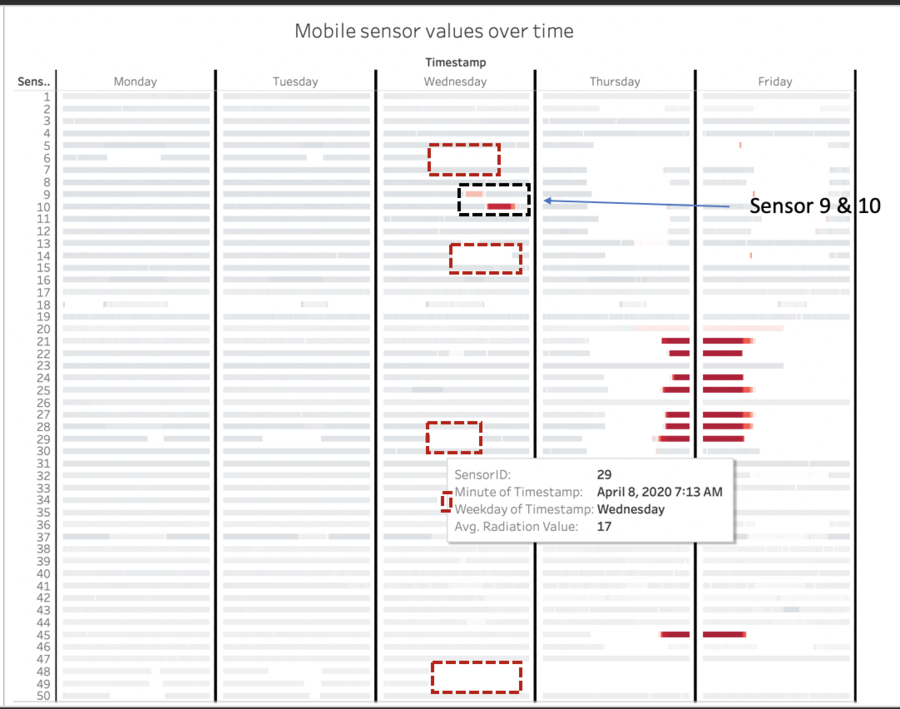
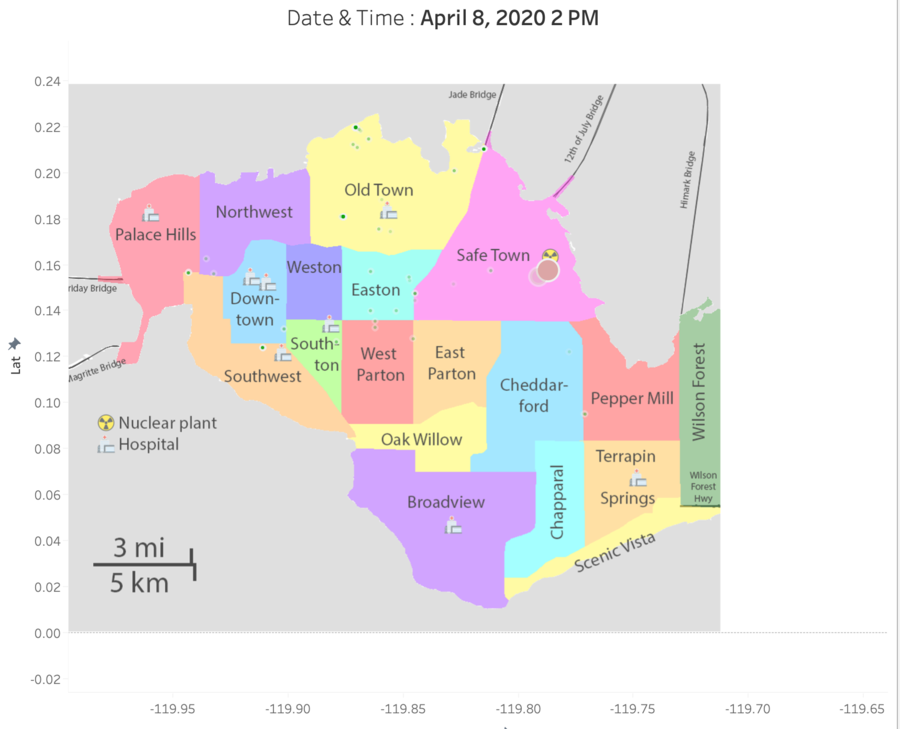
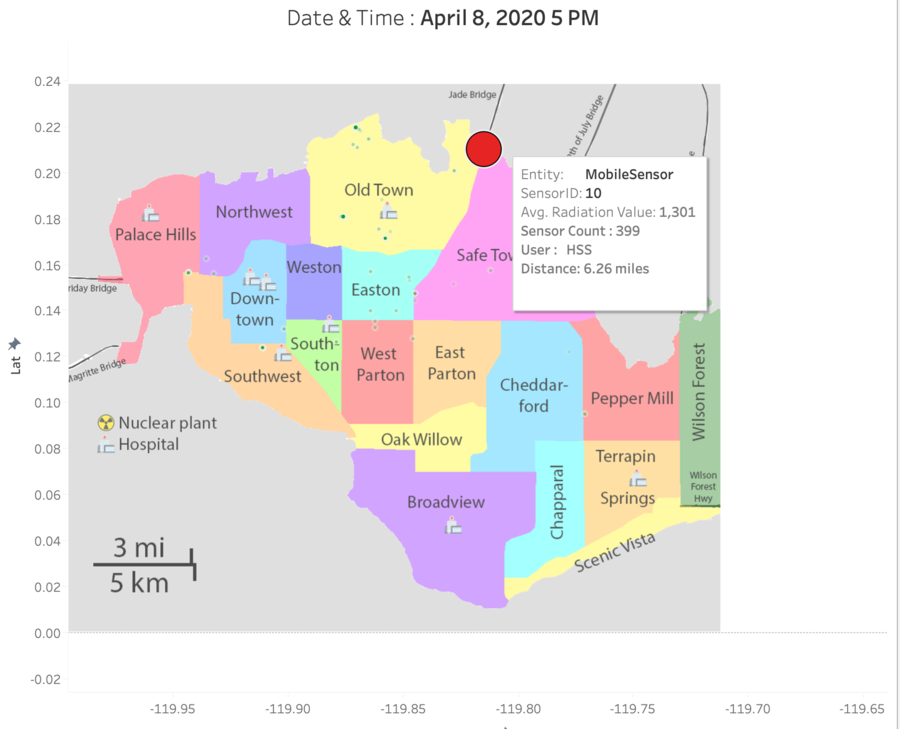
The earthquake might have happened around 7.10am on 8th April. A bunch of mobile sensors lost connectivity on the morning of 8th April around 7.16 am - 7.30 am. This might have caused a radiation leak at the nuclear plant. Shortly afterward from 1.26 pm to 4.27 pm, Mobile Sensor 9 which is driving beside the nuclear plant (Distance from plant = 0.62 miles), detected an increase in radiation level to 1301. At 5 pm, there was a surge in radiation levels at the entrance of the Jade bridge (Distance from plant = 6.26 miles). Subsequently, there is an increase in radiation levels among radiation levels from 8th April onwards and more sensors stopped functioning. |
| No. | Description |
|---|---|
|
1 |
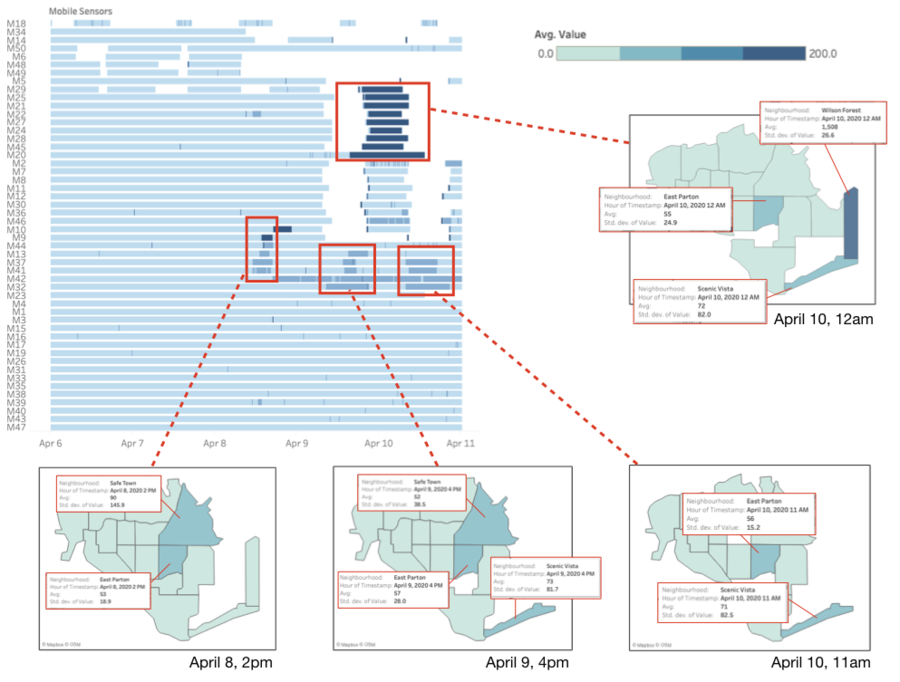
In situations where multiple areas show signs of possible contamination and the city lacks resources to assess all of them given that the readings might be inaccurate, a decision can be made based on the number of sensors in the region. If a particular region has a large number of sensors with high average ratings, it is more likely that it is indeed a contaminated area. However, caution has to be taken as just 1 rogue sensor with extremely high readings can bring up the overall average. Hence, a decision has to be made after carefully comparing the standard deviation and number of sensors. |
| No. | Description |
|---|---|
|
2 |
Possibly contaminated areas throughout the simulation are East Parton, Safe Town, East Parton, and Scenic Vista. |
| No. | Description |
|---|---|
|
3 |
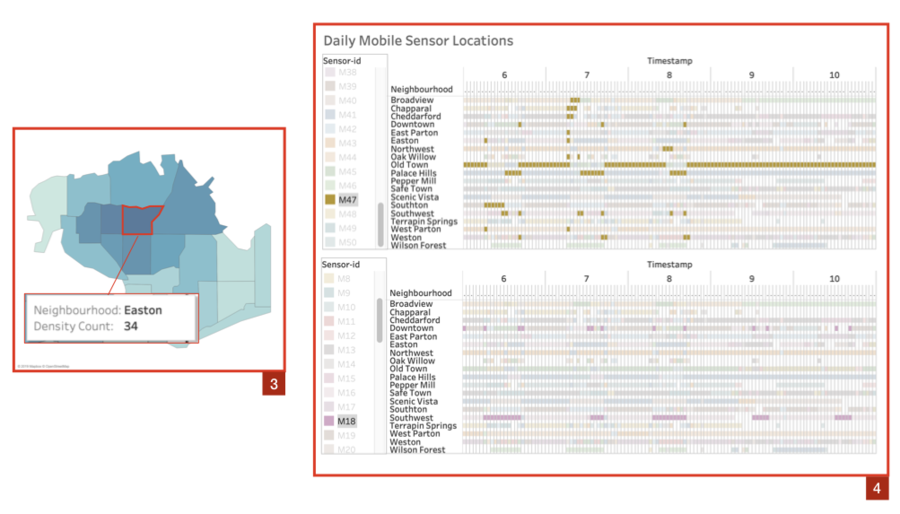
The number of cars travelling through each region plays a part in analysing possible contaminations. For example, 34 out of the 50 cars passed by Easton during the simulation, meaning that Easton is frequently visited by the majority of St.Himark’s residents. Should there be a radioactive leak or contaminant in Easton, there is a high chance that it might contaminate all the other cars that pass by and spread to the other regions. |
|
4 |
Another concern is the routine of each individual car. Some cars pass through a large number of regions daily, and some stay within 1 or 2 regions. If an extremely mobile car gets contaminated and goes about its daily routine, it may spread the contaminant to the all regions it visits. |
Estimate how many cars may have been contaminated when coolant leaked from the Always Safe plant. Use visual analysis of radiation measurements to determine if any have left the area.
| No. | Description |
|---|---|
|
5 |
These 9 cars were parked at the southern side of the island overnight, and gradually left the island via Wilson Forest Highway during the day on April 9. |
|
6 |
Mobile sensor 20 remained stationary throughout the day, inside Scenic Vista. Radiation readings were normal until about 3pm on April 9, when readings began to spike. This could be when the coolant leak happened. |
|
7 |
The cars that left via Wilson Forest Highway returned that night with normal radiation readings upon entering. However, they quickly began reporting extremely high radiation readings as well, and remained at Wilson forest overnight before leaving St.Himark again on the morning of April 10. If those cars got contaminated from spending the night at Wilson Forest, the authorities should be very concerned as the contamination could be spread to other cities that are connected to St.Himark. |
Indicated where you would deploy more sensors to improve radiation monitoring in the city. Would you recommend more static sensors or more mobile sensors or both? Use your visualization of radiation measurement uncertainty to justify your recommendation.
| No. | Description |
|---|---|
|
8 |
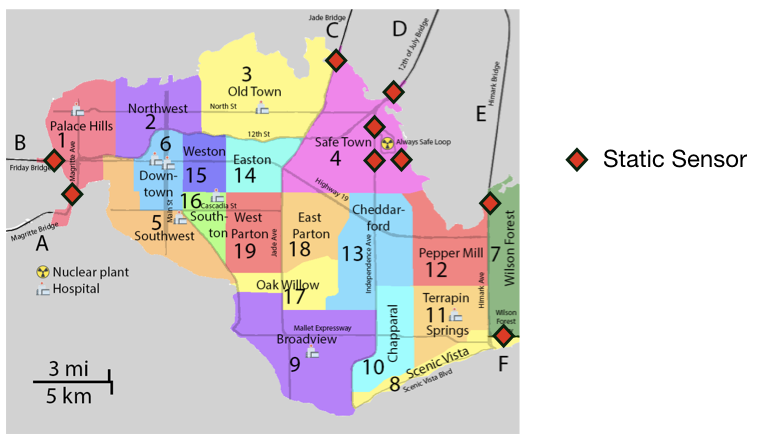
Static Sensor 15 was supposed to be the first hand indication of radiation leaks, given its position right outside the nuclear plant. However, it’s premature failure during the simulation resulted in the lack of an immediate indicator. The static sensors’ short range also limited its usefulness in analysis of contamination and its spread. As the static sensors are costly, I would recommend repositioning the 9 existing sensors. To facilitate detection of radiation leaks, 3 static sensors should be placed in the vicinity of the always safe loop. This way, we will still have data if one or two of the sensors become damaged. The remaining 6 sensors should be placed at the start of each of the 6 bridges that connect St.Himark. This will help detect any form of contamination that is being carried to and from the city, and help authorities contain the contamination. |
|
9 |
As the mobile sensors are relatively cheaper, radiation monitoring within the city could be improved with the deployment of even more mobile sensors. With more mobile sensors there will be lower uncertainty in measurements and higher coverage, making for more meaningful analysis of the situation within the city. If increasing the number of mobile sensors is not possible, they should aim to even out the distribution of the mobile sensors, by selecting cars with different travel patterns. |
