Difference between revisions of "IS428 AY2019-20T1 Assign Benedict Then Question 5"
Jxthen.2017 (talk | contribs) |
Jxthen.2017 (talk | contribs) |
||
| Line 44: | Line 44: | ||
[[File:Static collections.jpg|500px|thumb|center|Static Collections]] | [[File:Static collections.jpg|500px|thumb|center|Static Collections]] | ||
<br> | <br> | ||
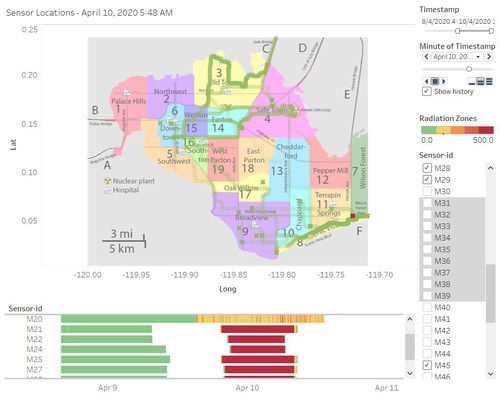
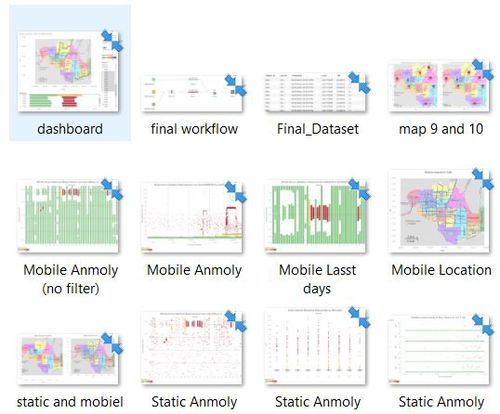
| − | I used a mix of static collection and dynamic stream of data. Since this dataset | + | I used a mix of static collection and dynamic stream of data. Since this dataset mainly drives from the time periods and sensor coordinates. I started plotting a time-lapse visualization dashboard of the sensors' radiation measurements occurring at different coordinates during a time period. This helped me better understand the patterns of the radiation readings and identify areas of concerns. Such as when and which sensors have high radiation readings and where they were located at the period of time. From then, I compiled a static collection of areas of concerns. The static collection consists of time periods when the radiation readings were high, which sensors specifically high readings and the exact location of when the vehicle got contaminated etc. |
Revision as of 22:20, 12 October 2019
|
|
|
|
|
|
5.The data for this challenge can be analyzed either as a static collection or as a dynamic stream of data, as it would occur in a real emergency. Describe how you analyzed the data - as a static collection or a stream. How do you think this choice affected your analysis? Limit your response to 200 words and 3 images
I used a mix of static collection and dynamic stream of data. Since this dataset mainly drives from the time periods and sensor coordinates. I started plotting a time-lapse visualization dashboard of the sensors' radiation measurements occurring at different coordinates during a time period. This helped me better understand the patterns of the radiation readings and identify areas of concerns. Such as when and which sensors have high radiation readings and where they were located at the period of time. From then, I compiled a static collection of areas of concerns. The static collection consists of time periods when the radiation readings were high, which sensors specifically high readings and the exact location of when the vehicle got contaminated etc.


