Difference between revisions of "IS428 AY2019-20T1 Assign Benedict Then Question 5"
Jump to navigation
Jump to search
Jxthen.2017 (talk | contribs) (Created page with "<div style=background:#000000 border:#A3BFB1> 200px|frameless <font size = 5; color="#FFFFFF">VAST 2019 MC2: Citizen Science to the Rescue</font> </div>...") |
Jxthen.2017 (talk | contribs) |
||
| Line 38: | Line 38: | ||
|} | |} | ||
| + | |||
| + | ===5.The data for this challenge can be analyzed either as a static collection or as a dynamic stream of data, as it would occur in a real emergency. Describe how you analyzed the data - as a static collection or a stream. How do you think this choice affected your analysis? Limit your response to 200 words and 3 images=== | ||
| + | |||
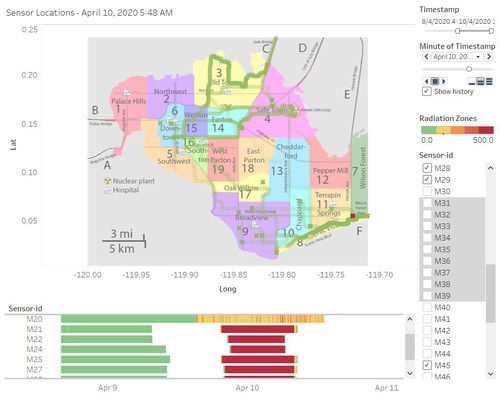
| + | [[File:Dashboard.jpg|thumb|left|500px|Dashboard to show the sensors radiation readings coupled with the time & location]] | ||
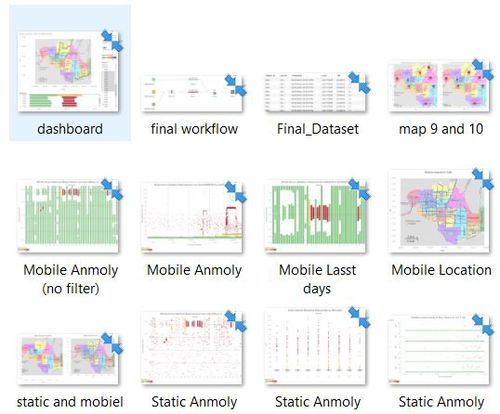
| + | [[File:Static collections.jpg|500px|thumb|center|Static Collections]] | ||
| + | <br> | ||
| + | I used a mix of static collection and dynamic stream of data. Since this dataset involves a lot of timestamp and coordinates. I started plotting a time-lapse visualization of radiation measurements occurring at different coordinates. This helped me better understand the patterns of the radiation readings and identify areas of concerns. From then, I compiled a static collection of areas of concerns. The static collection consists of time periods when the radiation readings and the location of the radiation leaked etc. | ||
Revision as of 22:15, 12 October 2019
|
|
|
|
|
|
5.The data for this challenge can be analyzed either as a static collection or as a dynamic stream of data, as it would occur in a real emergency. Describe how you analyzed the data - as a static collection or a stream. How do you think this choice affected your analysis? Limit your response to 200 words and 3 images
I used a mix of static collection and dynamic stream of data. Since this dataset involves a lot of timestamp and coordinates. I started plotting a time-lapse visualization of radiation measurements occurring at different coordinates. This helped me better understand the patterns of the radiation readings and identify areas of concerns. From then, I compiled a static collection of areas of concerns. The static collection consists of time periods when the radiation readings and the location of the radiation leaked etc.


