Difference between revisions of "IS428 AY2019-20T1 Assign Lee Cheng Leng Task 3"
Cllee.2017 (talk | contribs) |
Cllee.2017 (talk | contribs) |
||
| Line 50: | Line 50: | ||
! S/N !! Findings !! Visual Proof | ! S/N !! Findings !! Visual Proof | ||
|- | |- | ||
| − | |A-1|| To identify locations of contamination, we look at locations with consistently high radiation readings within a time period. | + | |A-1|| To identify locations of contamination, we look at locations with consistently high radiation readings within a time period. <br> |
| − | |||
Potential locations of contamination: | Potential locations of contamination: | ||
* Old Town, on 8 April from 1700 to 2000 | * Old Town, on 8 April from 1700 to 2000 | ||
| + | * Safe Town, on 8 April from 1300 to 1600 | ||
| + | * Scenic Vista, from 9 April 1500 to 10 April 1300 | ||
| + | * Safe Town, from 9 April 1400 to 2000 | ||
* Wilson Forest, Scenic Vista from 9 April 2000 to 10 April 0600 | * Wilson Forest, Scenic Vista from 9 April 2000 to 10 April 0600 | ||
|| Example | || Example | ||
|- | |- | ||
| − | | | + | | A-2|| |
| − | + | * Contaminated Cars in the '''Old Town''' vicinity: Sensor-id 10 | |
| − | + | * Contaminated Cars in the '''Safe Town vicinity''' from '''9 April, 1300 to 1600''': Sensor-id 9 | |
| + | * Contaminated Cars in the '''Scenic Vista''' vicinity: Sensor-id 20 | ||
| + | * Contaminated Cars in the '''Safe Town''' vicinity from '''9 April, 1400 to 2000''': Sensor-ids 43, 32, 13, | ||
| + | * Contaminated Cars in the '''Wilson Forest''' vicinity: Sensor-ids 29, 45, 22, 27, 28, 24, 21 | ||
|} | |} | ||
| Line 69: | Line 74: | ||
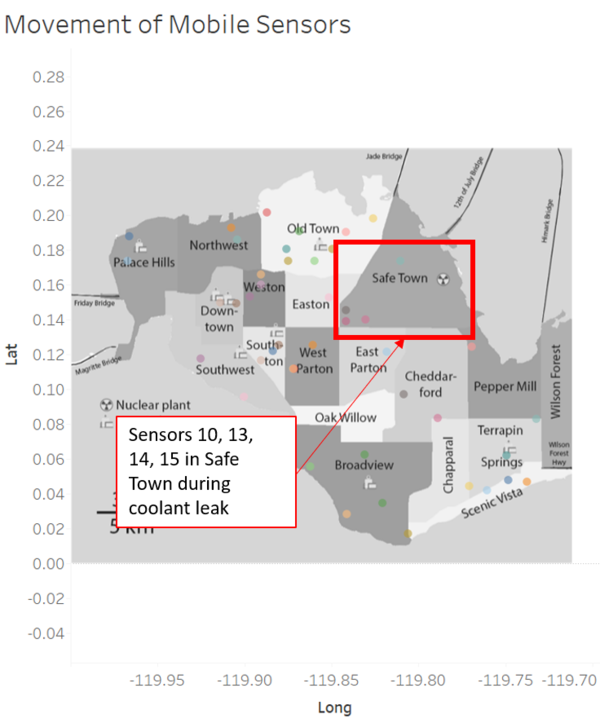
| B-1|| Based on my deduction from Task 2A-3, the coolant leak happened around 0200 on 9 April. | | B-1|| Based on my deduction from Task 2A-3, the coolant leak happened around 0200 on 9 April. | ||
| − | The mobile sensors which were in Safe Town during that time period are sensor-ids 10, 15, 13, 14. || [[File: | + | The mobile sensors which were in Safe Town during that time period are sensor-ids 10, 15, 13, 14. |
| + | || [[File:Task 3B-3.png|600px|frameless]] | ||
|- | |- | ||
| B-2|| | | B-2|| | ||
| Line 81: | Line 87: | ||
|| [[File:Task3B-1.png|600px|frameless]] | || [[File:Task3B-1.png|600px|frameless]] | ||
[[File:Task3B-2.png|600px|frameless]] | [[File:Task3B-2.png|600px|frameless]] | ||
| − | |||
| − | |||
| − | |||
| − | |||
|} | |} | ||
Revision as of 19:52, 12 October 2019
|
|
|
|
|
|
|
|
|
|
|
|
|
Given the uncertainty you observed in question 2, are the radiation measurements reliable enough to locate areas of concern?
a. Highlight potential locations of contamination, including the locations of contaminated cars. Should St. Himark officials be worried about contaminated cars moving around the city?
| S/N | Findings | Visual Proof |
|---|---|---|
| A-1 | To identify locations of contamination, we look at locations with consistently high radiation readings within a time period. Potential locations of contamination:
|
Example |
| A-2 |
|
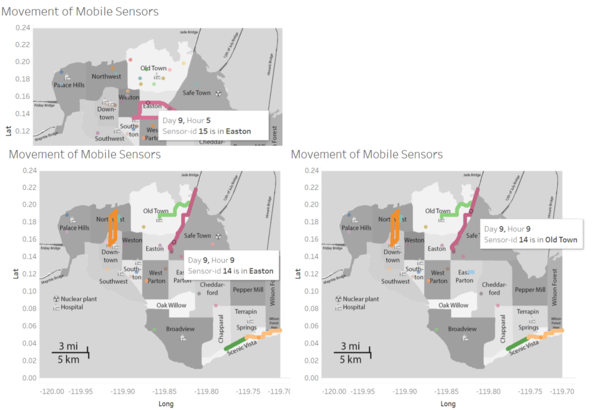
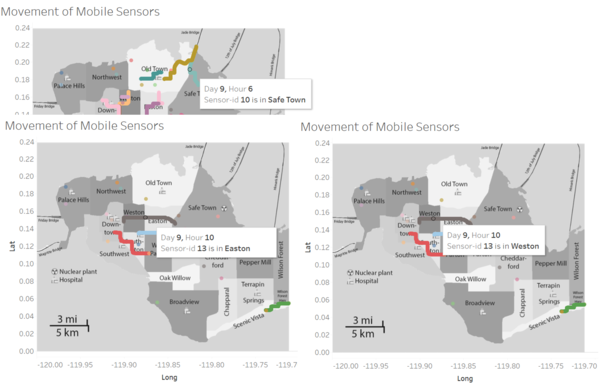
b. Estimate how many cars may have been contaminated when coolant leaked from the Always Safe plant. Use visual analysis of radiation measurements to determine if any have left the area.
c. Indicated where you would deploy more sensors to improve radiation monitoring in the city. Would you recommend more static sensors or more mobile sensors or both? Use your visualization of radiation measurement uncertainty to justify your recommendation.
| S/N | Findings | Visual Proof |
|---|---|---|
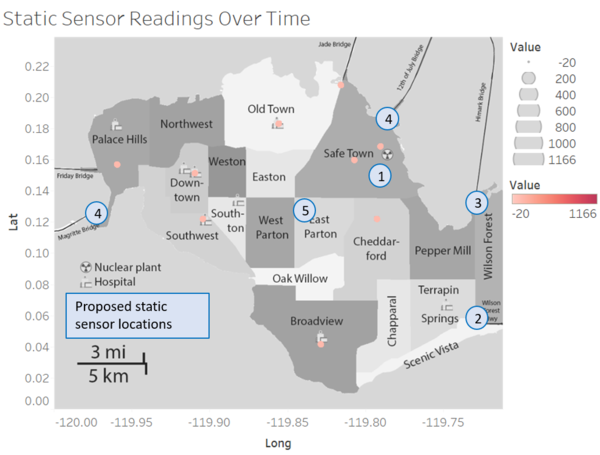
| C-1 | I would deploy more static sensors in the following areas:
1: Around the Stay Safe plant As for Location 1, more static sensors are required to be deployed in the immediate perimeter of the plant as an accurate and timely reading would be required in order to swiftly detect any coolant leak. In the case where the sensor malfunctions such as static sensor-id 15 in this scenario, there would be other static sensors in the area to detect changes in radiation levels. For Location 2, Wilson Forest Highway was found to be an area experiencing high uncertainty due to the high variance in its radiation readings. Deploying a static sensor here would be useful in detecting any contamination from cars entering St. Himark using the highway. For Location 3 and 4, static sensors can be deployed at all major highways or bridges to other cities in order to check if the spread of radiation is from an external source or if a nuclear disaster has happened in St. Himark. For Location 5, it was found that there was lack of static sensor converage in the inland neighbourhoods of St. Himark. East Parton was chosen due to its proximity to the nuclear plant, as well as the high uncertainty experienced by this neighbourhood. |
|
| C-2 | There is also a need to deploy more mobile sensors. Given the uncertainty in the measurements of mobile sensors, it would be useful to increase the number of mobile sensors and thus the coverage and number of readings taken.
This is since there are some neighbourhoods which did not record any radiation readings at certain time periods. |
Refer to Point 2C-2 under IS428 AY2019-20T1 Assign Lee Cheng Leng Task 2 |


