Difference between revisions of "IS428 AY2019-20T1 Assign Lim Zi Yuan 5"
Jump to navigation
Jump to search
(Created page with "<div style=background:#3D5480 border:#A3BFB1> <font size = 5; color="#FFFFFF">VAST 2019 MC2: Citizen Science to the Rescue</font> </div> {|style="background-color:#3D5480;"...") |
(/* The data for this challenge can be analyzed either as a static collection or as a dynamic stream of data, as it would occur in a real emergency. Describe how you analyzed the data - as a static collection or a stream. How do you think this choice af...) |
||
| (2 intermediate revisions by the same user not shown) | |||
| Line 7: | Line 7: | ||
| style="font-family:Century Gothic; font-size:100%; solid #000000; background:#3D5480; text-align:center;" width="20%" | | | style="font-family:Century Gothic; font-size:100%; solid #000000; background:#3D5480; text-align:center;" width="20%" | | ||
; | ; | ||
| − | [[IS428_AY2019- | + | [[IS428_AY2019-20T1_Assign_Lim_Zi_yuan| <font color="#FFFFFF">Problem and Motivation</font>]] |
| style="font-family:Century Gothic; font-size:100%; solid #1B338F; background:#3D5480; text-align:center;" width="20%" | | | style="font-family:Century Gothic; font-size:100%; solid #1B338F; background:#3D5480; text-align:center;" width="20%" | | ||
; | ; | ||
| Line 38: | Line 38: | ||
|} | |} | ||
| − | == | + | ==The data for this challenge can be analyzed either as a static collection or as a dynamic stream of data, as it would occur in a real emergency. Describe how you analyzed the data - as a static collection or a stream. How do you think this choice affected your analysis? Limit your response to 200 words and 3 images.== |
| + | |||
| + | |||
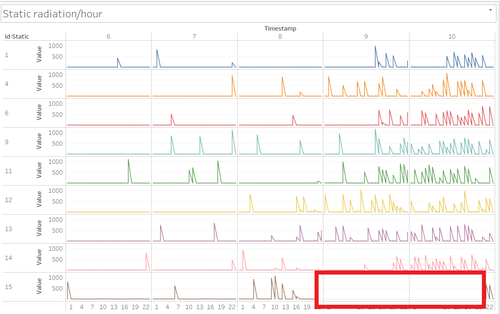
| + | I analyzed the data using both static and dynamic techniques. Having a dynamic stream of data allows us to monitor data change over time whilst a static collection looks at 'fixed' data. I mostly used dynamic data to discover patterns over a time period, minute/hour/day. An instance of this would be the use of the line graph plotted against hours. By doing so, I am able to compare between each sensor at any given hour, allowing me to identify hidden patterns. | ||
| + | |||
| + | [[File:Static hourly reading.png|500px|centre]] | ||
Latest revision as of 04:14, 12 October 2019
VAST 2019 MC2: Citizen Science to the Rescue
|
|
|
|
|
The data for this challenge can be analyzed either as a static collection or as a dynamic stream of data, as it would occur in a real emergency. Describe how you analyzed the data - as a static collection or a stream. How do you think this choice affected your analysis? Limit your response to 200 words and 3 images.
I analyzed the data using both static and dynamic techniques. Having a dynamic stream of data allows us to monitor data change over time whilst a static collection looks at 'fixed' data. I mostly used dynamic data to discover patterns over a time period, minute/hour/day. An instance of this would be the use of the line graph plotted against hours. By doing so, I am able to compare between each sensor at any given hour, allowing me to identify hidden patterns.
