Difference between revisions of "IS428 AY2019-20T1 Assign Christine Interactive Visualization"
| Line 93: | Line 93: | ||
| <center><b>Navigation button (Image & Text)</b></br> | | <center><b>Navigation button (Image & Text)</b></br> | ||
''*Navigation button will be available for every pages/dashboards''</center></br> | ''*Navigation button will be available for every pages/dashboards''</center></br> | ||
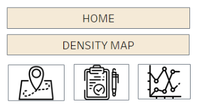
| − | <div id="Fc. | + | <div id="Fc.8">[[File:christine.2016_figure_c.8_NavigationButton.png|200px|frameless|center]] |
| − | <center>''Figure c. | + | <center>''Figure c.8 - Navigation Button''</center></div> |
|| | || | ||
<center>To provide users the flexibility of navigating from one dashboard to another. With image, it also provides value adding point in terms of aesthetic.</center> | <center>To provide users the flexibility of navigating from one dashboard to another. With image, it also provides value adding point in terms of aesthetic.</center> | ||
|| | || | ||
| − | * | + | * Select / create the image of buttons and place the image in the directory. |
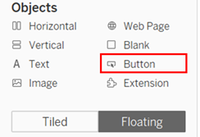
| + | * In dashboard find the Objects section and drag the Button (Floating mode). | ||
| + | : <div id="Fc.9">[[File:christine.2016_figure_c.9_Objects.png|200px|frameless|center]] | ||
| + | <center>''Figure c.9 - Objects Attributes''</center></div> | ||
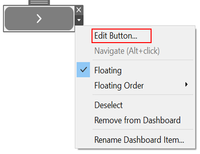
| + | * After button was created click on the arrow beside the button and choose '''‘Edit button’'''. | ||
| + | : <div id="Fc.10">[[File:christine.2016_figure_c.10_EditButton.png|200px|frameless|center]] | ||
| + | <center>''Figure c.10 - Edit Button''</center></div> | ||
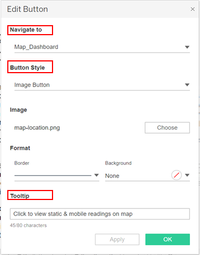
| + | * Dialog box will appear. Set where this button will navigate to; choose whether this button in Text of Image button; choose whether borderline was needed; and input tooltip (optional). | ||
| + | : <div id="Fc.11">[[File:christine.2016_figure_c.11_EditButtonDialog.png|200px|frameless|center]] | ||
| + | <center>''Figure c.11 - Edit Button Dialog Box''</center></div> | ||
|- | |- | ||
| − | | <center><b> | + | | <center><b>Tooltip</b></center> |
| − | |||
| − | |||
|| | || | ||
| − | <center>To provide | + | <center>To provide users with some contextual information about action performed by the navigation button.</center> |
|| | || | ||
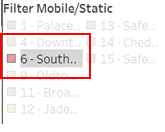
| − | * | + | * Tooltip can be accessed by selecting the arrow beside the button, then click on “Edit button” and provide the information needed under Tooltip textbox. |
| + | : <div id="Fc.12">[[File:christine.2016_figure_c.10_EditButton.png|200px|frameless|center]] | ||
| + | <center>''Figure c.12 - Edit Button''</center></div></br> | ||
| + | : <div id="Fc.13">[[File:christine.2016_figure_c.11_EditButtonDialog.png|200px|frameless|center]] | ||
| + | <center>''Figure c.13 - Edit Button Dialog Box''</center></div> | ||
|- | |- | ||
|} | |} | ||
Revision as of 20:24, 10 October 2019
Visualization of Always Safe Nuclear Power Plant can be accessed here: <URL>.
More details on the individual dashboard as follow:
In this case, a large dataset is provided to the investigator to conduct a deep analysis of the problem in St. Himark. Due to large dataset, numerous analysis is needed in order to provide better insight in detecting the cause of the problem or even propose a solution to the detected problem. As such, it will be impossible to display all analyses in a single dashboard. While these analyses are interrelated to each other hence, there is no sequential order that should be followed. To resolve these issues, flexibility has become the main solution where it should provide users the flexibility to navigate the dashboard from one to another. To do so, the interactive button was created with 5 different categories – Homepage, Density Map, Map Dashboard, Radiation Level Readings, and Cumulative Sum of Sensors Readings. Each of these categories will be a further breakdown and provide the freedom of users to choose the analysis that they interested in.
Contents
COMMON INTERACTIVE FEATURES ACROSS ALL PAGES/DASHBOARDS
These interactive features will be available across all pages / dashboards.
| Interactive Technique | Rationale | Implementation Step |
|---|---|---|
* Except Density Map |
|
|
|
|
|
HOMEPAGE
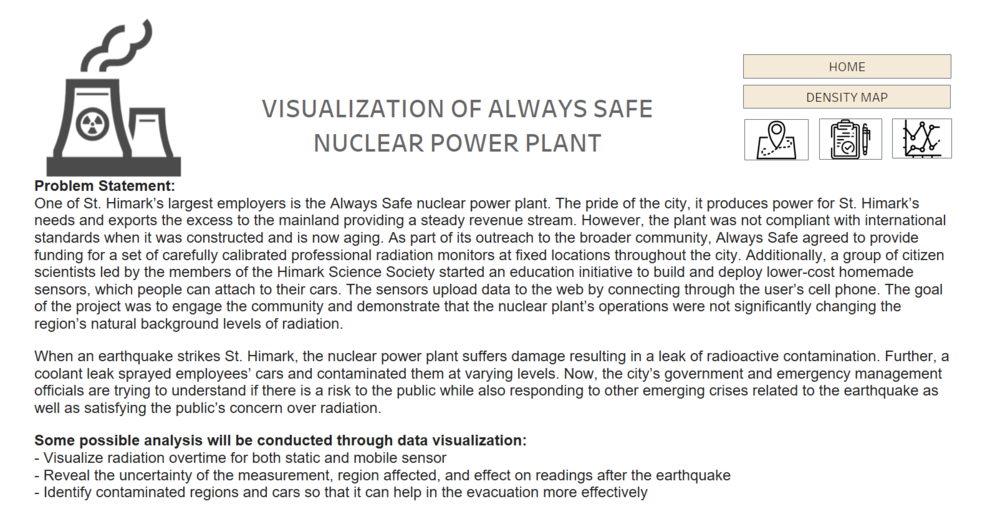
In this page, there will be brief write-up for the problem statement as well as motivation behind this analysis conducted along with the navigation buttons.
| Interactive Technique | Rationale | Implementation Step |
|---|---|---|
*Navigation button will be available for every pages/dashboards |
|
|
|
|
|
MAP DASHBOARD
FINAL WORKFLOW AND DATASET
FINAL WORKFLOW AND DATASET

