Difference between revisions of "IS428 AY2019-20T1 Assign Nurul Khairina Binte Abdul Kadir Data"
| Line 150: | Line 150: | ||
3. Add Cleaning and Output steps. <br> | 3. Add Cleaning and Output steps. <br> | ||
| − | The final | + | This dataset will be known as '''MC1-Relationship''' and will be loaded into Tableau. |
| + | |||
| + | The final flow in Tableau Prep will be as follows: <br> | ||
[[File:Final Pivot Flow - New Data Source.jpg|500px|center]] | [[File:Final Pivot Flow - New Data Source.jpg|500px|center]] | ||
| Line 158: | Line 160: | ||
| Screenshot || | | Screenshot || | ||
[[File:Relationship between Shake and Other Damage Types.jpg|820px|center]] | [[File:Relationship between Shake and Other Damage Types.jpg|820px|center]] | ||
| − | <center>Before and After</center> <br> | + | <center>Before and After </center> <br> |
|} | |} | ||
Revision as of 06:11, 9 October 2019
VAST 2019 MC1: Crowdsourcing for Situational Awareness
|
|
|
|
|
|
Contents
Data Description
The first step in the transformation process begins with understanding and interpreting the data to determine which data type we currently have and what we need to transform it into.
The data zip file consists of 1 CSV file (mc1-reports-data.csv) spanning the entire length of the event from 6 April 2020, 12 AM to 11 April 2020, 12 AM and 2 shakemap images. The CSV file contains the individual reports (categorical) of shaking/damage by neighborhood over time. Reports are made by citizens at any time through the Rumble mobile app. However, they are only recorded in 5-minute batches/increments due to the server configuration. Furthermore, delays in the receipt of reports may occur during power outages.
Data Attributes of CSV File
| Data Attributes | Description |
|---|---|
| Time | Timestamp of incoming report/record, in the format YYYY-MM-DD hh:mm:ss |
| Location | ID of neighborhood where person reporting is feeling the shaking and/or seeing the damage |
| Shake Intensity, Sewer and Water, Power, Roads and Bridges, Medical, Buildings | Reported categorical value of how violent the shaking was/how bad the damage was (0 - lowest, 10 - highest; missing data allowed) |
Shakemap Images, Shape File and Map Images
Also included are two shakemap (PNG) files which indicate where the corresponding earthquakes' epicenters originate as well as how much shaking can be felt across the city. The StHimark shape file and map images which are obtained from the dataset of Mini Challenge 2 is used to create the map of the city.
Dataset Analysis & Transformation Process
The following section illustrates the issues faced in the data analysis phase leading to a need to transform the data into a specified format. Tableau Prep will be used to clean and prepare the data for analysis. The CSV file is converted to Excel in order to import it into Tableau Prep.
Data Transformation for MC1-Report-Data
There are 3 main issues with the given dataset and data transformation is needed to reshape the data for easier analysis.
1. Inability to filter by damage type
2. Neighbourhood coordinates
3. Relationship between shake intensity and other damage types
Pivot the Damage Types
| Issue | Inability to filter by damage type |
| Solution | Pivot the following columns - Shake Intensity, Sewer and Water, Power, Roads and Bridges, Medical and Buildings. Pivoting the data will create more rows for each time and location. This will provide users with the ability to filter the data based on the damage type which is needed for further analysis. |
| Steps Taken |
1. Connect to the data source |
| Screenshot |
|
Neighbourhood Coordinates
| Issue | A map will provide the emergency responders with a better idea of the extent of the damage in the various neighbourhoods in real-time. There are different ways to add a map in Tableau. The easiest way is to import the StHimark.shp file into Tableau. However, in some cases, it is clearer to map the points onto a background image instead of a Tableau map. The data zip file from Mini-Challenge 2 includes a blank PNG image of St. Himark. However, there are no coordinate points (latitude and longitude) to identify each neighbourhood in the dataset and the background image will not load since the X and Y coordinates are missing. |
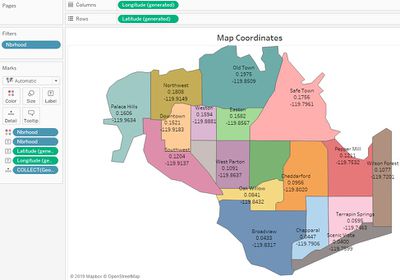
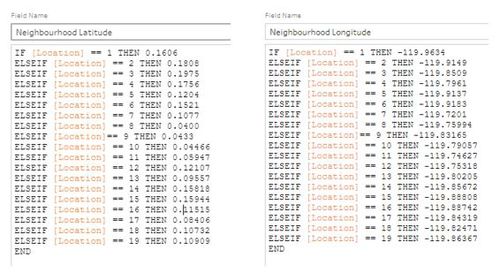
| Solution | One of the ways to get the coordinates of each neighbourhood is by using the shapefile. There are tools available online to get the coordinates and this is the manual way. Once the shapefile is imported into Tableau and a map is created in a worksheet, the latitude and longitude will be generated automatically. Display the coordinates of the map and use this as a reference. In Tableau Prep, create 2 calculated fields for Neighbourhood Latitude and Neighbood Longitude for each neighbourhood. |
| Steps Taken |
PART A: Working with Shapefiles 1. Go to Connections. Add a Spatial file. Select the StHimark.shp file. The coordinates of each neighborhood will be displayed on the map as follows:
1. Add a Clean step in the flow The calculated field formula will be as follows: |
| Screenshot |
|
Relationship Between Shake Intensity and Other Damage Types
| Issue | It is difficult to see the relationship between shake intensity and other types in the given dataset and the transformed dataset above. It is important to analyse this relationship since anomalies in the data can be detected. For example, if a city is greatly affected by the earthquake based on the shakemap and have a high shake intensity impact score, it will be unusual if the buildings/medical/power etc. is unsually low. Further investigation will be needed. |
| Solution | Using the given dataset, pivot the following columns: Buildings, Medical, Power, Roads and Bridges and Sewer and Water. Shake intensity should not be included here. Export the data. A new data source have to be created in Tableau. |
| Steps Taken |
1. Use the same flow. Add a Pivot step. Drag the columns mentioned above into Pivot values. This dataset will be known as MC1-Relationship and will be loaded into Tableau. The final flow in Tableau Prep will be as follows: |
| Screenshot |
|
Addition of Columns In Transformed Dataset
The following columns are added into the transformed dataset in 2.1.2 using Tableau Prep. This can be done at the Clean Step in the flow. With reference from the background information document, calculated fields are created for the following fields:
| Field | Description |
|---|---|
| Amenities | There are 4 possibilities. A neighborhood can have a school, hospital, hospital and school or no amenities. |
| 1st Hospital Name | The name of the hospital in the neighbourhood / nearest hospital |
| Specialization | The specialization of each hospital |
This is a sample of the final dataset known as MC1-Main which will be loaded into Tableau.


