IS428 AY2019-20T1 Assign Victor Lin Findings4
Jump to navigation
Jump to search
 VAST Challenge MC2: Citizen Science to the Rescue
|
|
|
|
|
|
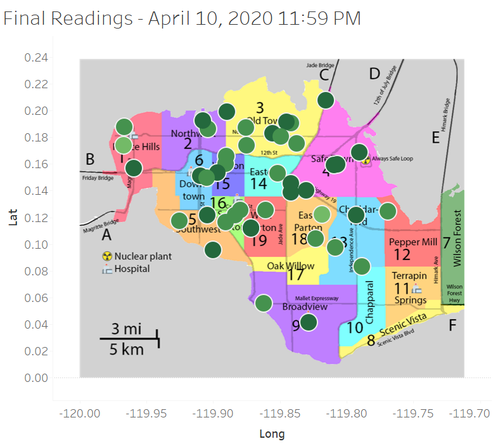
Q4. Summarize the state of radiation measurements at the end of the available period. Use your novel visualizations and analysis approaches to suggest a course of action for the city. Use visual analytics to compare the static sensor network to the mobile sensor network. What are the strengths and weaknesses of each approach? How do they support each other?

Overall, radiation readings have returned to safe levels. One course of action that the city can take is to train up more citizen scientists. By training up more citizen scientists, we can get their help in employing more homemade mobile sensors to collect data on the radiation levels. Furthermore, with increased expertise, the citizen scientists can help rectify any issues with existing sensors that are giving erroneous readings, reducing the uncertainty faced currently. With an increase in the numbers of mobile sensors, the coverage of the mobile sensor network will definitely improve.
| Coverage Type | Strengths and Weaknesses |
|---|---|

|
The static sensor network offers reliable and accurate data on the radiation levels. Despite being more costly and having lower overall coverage than their mobile counterparts, the static sensors are less likely to be affected by external factors (such as being contaminated by a coolant leak) and thus have more reliable readings with lower uncertainty. However, there are limited mobile sensors available across the city due to the high costs associated with the deployment of these sensors. Furthermore, in larger regions such as Broadview and Cheddarford, having only 1 static sensor may not be enough to accurately assess radiation levels in the region due to the limited range of the mobile sensors. |

|
The mobile sensor network has better overall coverage than the static sensor network. This is due to the fact that the sensors are mounted on cars that travel throughout the entire city, collecting data as they pass through the various regions. These homemade mobile sensors are cheaper to employ and thus are available in larger numbers than their static counterparts. However, mobile sensors are susceptible to contamination due to their ease of mobility across the regions. As such, this adds to the problem that the sensors readings are not as reliable, with more frequent spikes in readings and elevated readings when contaminated. The mobile sensors also have trouble tracking the changes in radiation levels in a specific area over time, as the sensors are moving about all the time. As such, it is more difficult to understand changes in radiation levels over time by solely relying on the mobile sensor network. |
|
|
When combined together, the static and mobile sensor network complements one another. The mobile sensors help to address the issue of limited coverage of the static sensors, while static sensors help to provide more reliable readings in crucial regions such as Safe Town. The static sensors also help provide an overview of changes in radiation levels over time, which can then be used to check if any of the mobile sensors in the same area have been contaminated. By working in sync, the combined network helps St. Himark officials identify contaminated areas, aiding the construction of an emergency response plan with these areas of concern in mind. |
