IS428 AY2019-20T1 Assign Victor Lin Findings3
|
|
|
|
|
|
Contents
- 1 Q3. Given the uncertainty you observed in question 2, are the radiation measurements reliable enough to locate areas of concern?
- 1.1 a. Highlight potential locations of contamination, including the locations of contaminated cars. Should St. Himark officials be worried about contaminated cars moving around the city?
- 1.2 b. Estimate how many cars may have been contaminated when coolant leaked from the Always Safe plant. Use visual analysis of radiation measurements to determine if any have left the area.
- 1.3 c. Indicated where you would deploy more sensors to improve radiation monitoring in the city. Would you recommend more static sensors or more mobile sensors or both? Use your visualization of radiation measurement uncertainty to justify your recommendation.
Q3. Given the uncertainty you observed in question 2, are the radiation measurements reliable enough to locate areas of concern?
a. Highlight potential locations of contamination, including the locations of contaminated cars. Should St. Himark officials be worried about contaminated cars moving around the city?
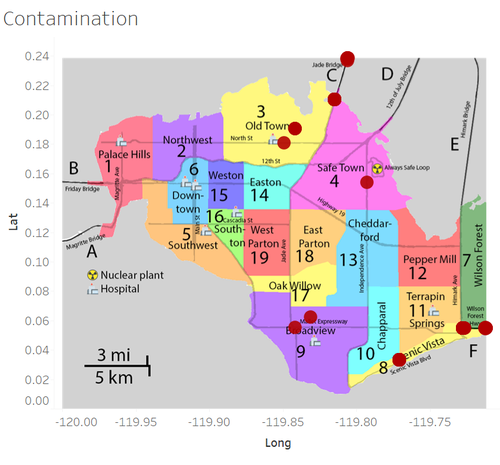
Based on the above visualisation, where radiation readings across the 5 days have been plotted and those below 200cpm filtered out, we see that potential locations of contamination include: Old Town, Safe Town, Jade Bridge, Wilson Forest Highway, Scenic Vista, and Broadview. Northwest only has one such reading throughout the entire period and thus could be seen as an anomaly rather than actually being an area with contamination.
Yes, the officials should be worried about contaminated cars moving around the city. Contaminated cars could possibly cause other sensors to falsely detect an increase in radiation levels in the area when these contaminated cars are in the range of the sensors. When a contaminated car is in range, a sensor will detect an increase in radiation levels, giving a false elevated reading.
b. Estimate how many cars may have been contaminated when coolant leaked from the Always Safe plant. Use visual analysis of radiation measurements to determine if any have left the area.
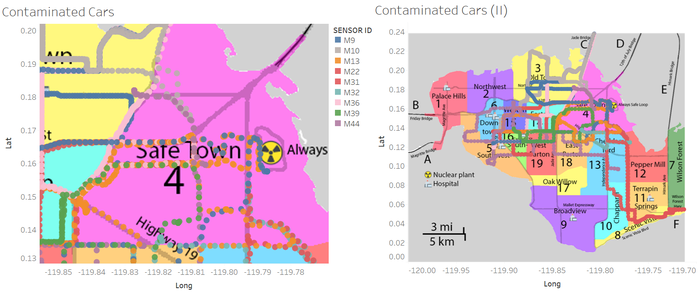
According to the visualisations, there were a total of 9 cars that were in the near vicinity of the Always Safe plant since the occurrence of the first earthquake. As such, these cars could have been contaminated by the coolant leak, which happened after the earthquake. The 9 cars are: Mobile Sensors 9, 10, 13, 22, 31, 32, 36, 39, and 44. By plotting the readings from each of these sensors starting from 8:36 AM on 8 April till the end of the period, we see that all 9 of the potentially contaminated cars did leave the area.
c. Indicated where you would deploy more sensors to improve radiation monitoring in the city. Would you recommend more static sensors or more mobile sensors or both? Use your visualization of radiation measurement uncertainty to justify your recommendation.
Static Sensors
| BEFORE | AFTER |
|---|---|
|
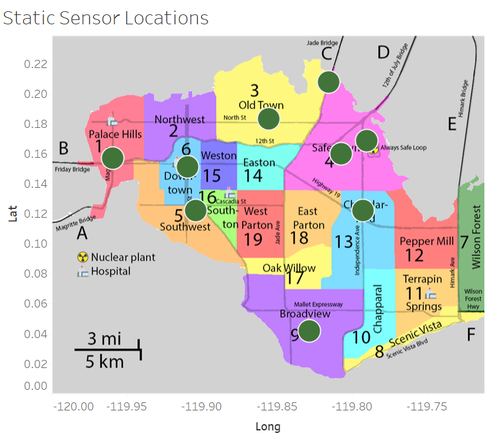
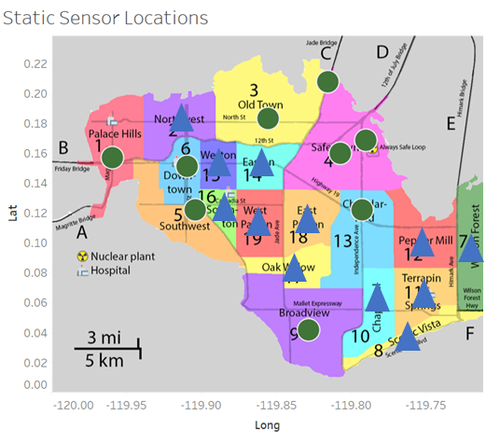
I would first ensure that every region in the city has at least one static sensor. As per the visualisation above, each blue triangle represents one new static sensor. These carefully calibrated professional radiation monitors are more reliable, and thus would help in establishing a baseline in radiation levels should the mobile sensors be absent in the various regions. For example, Wilson Forest and Pepper Mill, which had no readings available the entire period, leading to uncertainty with regards to the radiation level in the region.
Mobile Sensors
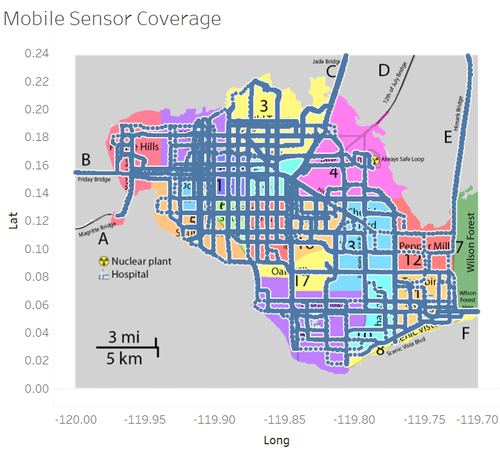
Aside from introducing more static sensors, there can also be more mobile sensors. On top of introducing more static sensors to increase overall coverage, additional mobile sensors can also help to validate readings by static sensors, ensuring accuracy of data. More mobile sensors will also allow for a more effective monitoring of radiation levels across an area, which static sensors cannot.
