IS428 AY2019-20T1 Assign Harvey Kristanto Lauw: Visualisation Task 3
|
|
|
|
|
|
|
|
|
Task 3: Change over time Analysis
How do conditions change over time? How does uncertainty change over time? Describe the key changes you see.
Approach
| Description | Reference |
|---|---|
|
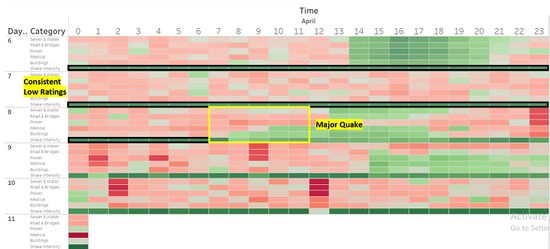
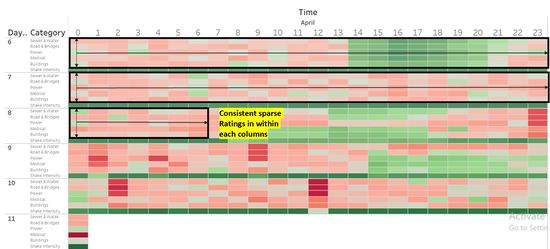
Conditions before Major Quake I can tell that the shake intensity has been constant until the hour of the impact of Major Quake (Refer to Figure 3.1). However, over time, the shake intensity has been following an inverse trend as compared to the damage ratings. By reading the context of this rating, normally we would deduce that the shake intensity the previous day would lead to the rating of damage for the other variables. However, throughout the whole record, it has been in an all-time low which does not correlate to the damaging impact on the other variables. As for the damage rating for other variables, they follow the same pattern and trends hourly (Refer to Figure 3.2). The number of records generated before the Major Quake for not as significant as they go up to approximately 500 records per day for each variable. |
|
|
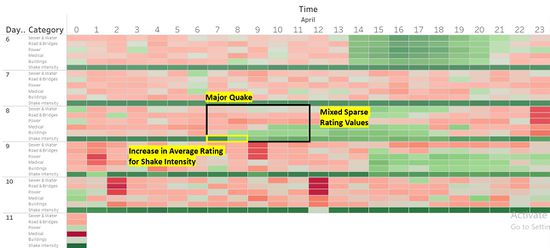
Conditions during Major Quake I can tell that even though the shake intensity rating is still in the low (Shades of green), it has increased in terms of average rating and the number of records up to at most 12998 records (Refer to Figure 3.3). As for the damage rating for other variables, it faces mix ratings because not every location has been affected and it mitigates the extreme values of high ratings if there is any. Likewise, vice versa for extreme values of low ratings (Refer to Figure 3.3).
|
|
|
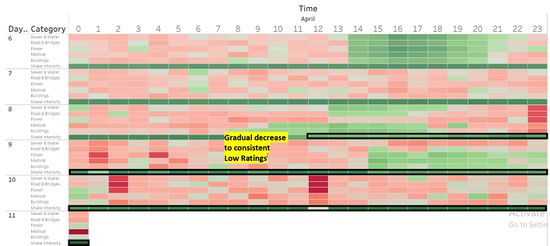
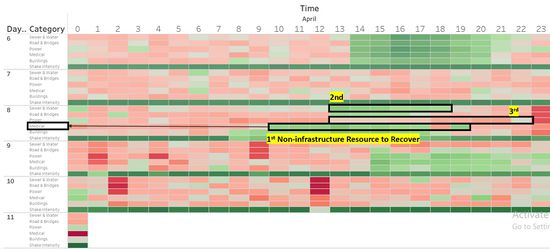
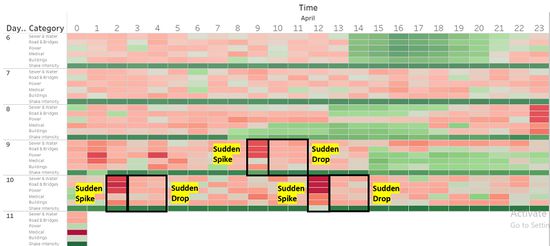
Conditions after Major Quake It is evident that the shake intensity rating has gone back to its original state of low rating and the number of records has dropped drastically as well (Refer to Figure 3.4). As for the damage rating for other variables, among the variables that are not infrastructure (E.i. Sewer & Water, Power and Medical). Medical was the first to recover as the damage rating for that variable has dropped earlier as compared to the rest. This is further supported with the least number of records where the population rates for medical. This would suggest that rescue efforts for the chosen area, will go to the Medical Resources first to support rescue operations even more (Refer to Figure 3.5). However, there are times where a sudden spike in data point would appear in the Calendar Heat Map right after the Major Quake (Refer to Figure 3.6). This creates more uncertainty to decide because it does not follow the similar trend of a gradual decrease right after the sudden spike similar to the behaviour of the data points during and after a Major Quake.
|
|

