From Visual Analytics and Applications
Jump to navigation
Jump to search
 Sofia City's Air Pollution Problem Analysis
Viz & Insights
Spatio-temporal Analysis of Official Air Quality
The Daily Trends.
| Patterns |
Visualization |
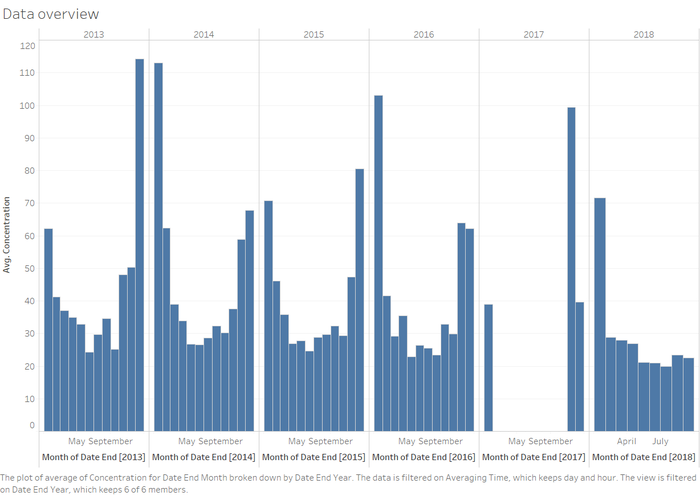
| 1. Setting the scene – General Overview of the data readings
The pollution recordings were broken down into monthly series and it was observed that the data between Feb 17 to Oct 17 is missing. To prevent the missing data from skewing the rest of the analysis, we exclude all readings taken in 2017.
It is also essential to note that the data has been transformed into two data sets based on time frame, namely daily and hourly.
The hourly data has been recomputed into daily, by averaging out the hourly readings, and added to the daily data set. This allows for clearer investigation by first looking at the daily observations, before delving and zooming into the hourly data set.
.
|
|
|
 Sofia City's Air Pollution Problem Analysis
