 Sofia City's Air Pollution Problem Analysis
Viz & Insights
The Daily Trends
Spatio-temporal Analysis of Official Air Quality.
| Patterns |
Visualization |
| 1. Setting the scene – General Overview of the data readings
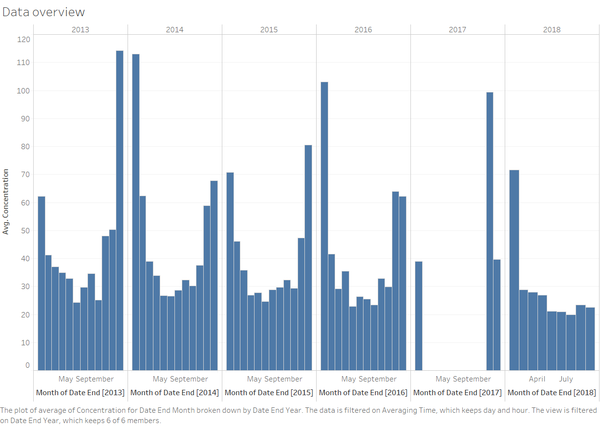
The pollution recordings were broken down into monthly series and it was observed that the data between Feb 17 to Oct 17 is missing (Refer to Figure 1.A below). To prevent the missing data from skewing the rest of the analysis, we exclude all readings taken in 2017.
Fig 1.B shows the most frequently visited paths (by gate categories) for all segments of visitors, in which we noticed the route “general gate-rangerstop-rangerstop-general gate” appeared very frequently. The high visitor volume indicates that most likely this path has most attractions in the reserve. For easier identification, this route will be addressed as “the most scenic route” in the subsequent analysis.
|
|
|
 Sofia City's Air Pollution Problem Analysis
