ISSS608 2018-19 T1 Assign Shen He
|
|
|
|
|
Bulgaria has a big problem
Europe's air pollution causes 46.7 thousand people per year, the European environment agency warned Thursday. Seventy thousand people die prematurely, and nine out of every 10 cities have residents breathing harmful gases. Poland came in last in the all-european air quality survey, while Bulgaria was ranked last in fine particulate matter (PM2.5) European countries with the highest average concentration.
PM2.5 is a diameter of less than 2.5 micron fine particle pollutant, which can cause asthma, heart disease, lung cancer and other diseases. More than 430,000 people were affected by PM2.5 within the Europe in 2013, according to the European environment agency. PM10 particles in air. Particle pollution is a mixture of solid particles and liquid droplets. PM10 particles (often described as coarse particles) are smaller than 10 micrometres (0.01 mm) in diameter. The PM10 data on our website is reported as a mass per volume of air – micrograms per cubic metre (µg/m3).
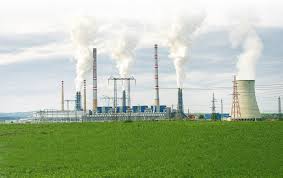
According to the European environment agency, the three countries with the highest five-year average PM2.5 are Bulgaria, Poland and the Czech republic. Among them, every cubic meter of air in Bulgaria of PM2.5 exceeds 25 micrograms. And the who's standard is that five-year average of PM2.5 should be less than or equal to 10 micrograms per cubic meter. In addition, Poland, which relies heavily on coal for power generation, was among the lowest in Europe in air quality testing. In 2013, Bulgaria accounted for four of Europe's five worst cities for particulate pollution. The country has spent 4.6 billion euros on health care costs related to coal-fired power generation.
How about Sofia city
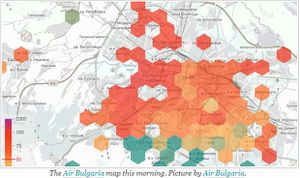
Since the strong winds have receded, the air quality in the Bulgarian capital of Sofia has worsened again. On the morning of January 20 2018, the concentration of particulate matter (PM), which is known to cause respiratory and heart diseases, as well as cancer, was high to very high in most of the city.
At around 7am, the concentration of PM10 was between 38 and 150µg/m³ (micrograms per cubic metre) in the eastern half of Sofia. A value of 50 is still seen as sort of acceptable, while 150 would be three times the acceptable amount. Regarding the even more dangerous PM2.5, between 19 and 58µg/m³ were measured in most of the eastern part of the city (source: Air Bulgaria).
In the northern part of the Gorublene quarter and most of the western part of the Bulgarian capital, the values were far worse. Here, the PM10 concentration was between 45 and 325µg/m³. The latter is an extremely high concentration, which was measured in the area between the Ovcha Kupel residential area and Zapaden Park. The PM2.5 concentration varied between 23 and 127µg/m³ in this part of Sofia.Only in the southern, more posh quarters of Dragalevtsi, Simeonovo and Boyana, the air quality was actually fine this morning. But in the rest of the city, the breathing air for 1.3 million inhabitants and hundreds of guests is bad and unhealthy. Up to six times the maximum PM concentration anyone should breathe was measured.
Our Datasets
1.Official air quality measurements (5 stations in the city)(EEA Data.zip)
This is EU guidelines on air quality monitoring. There are total 6 stations distributed in Sofia city.
The dataset consists of PM 10 concentration monitored by the stations from year 2013 to year 2018.

2.Citizen science air quality measurements (Air Tube.zip)
This dataset shows about the latitude and longitude and the corresponding PM2.5,PM10 concentration as well as temperature, humidity and pressure.

3.Meteorological measurements (1 station)(METEO-data.zip)
This dataset shows the daily meteorological index from year 2012 to year 2018.

4.Topography data (TOPO-DATA)
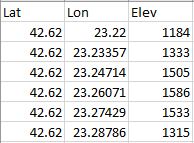
This dataset consists of latitude, longtitude and elevation of Sofia urban area and some areas nominally external to the city (toward Vitosha mountain)

Technique
1.To perform the visual analysis, i use the following softwares for data visualization:
- Tableau
- JMP Pro
2.Reference
- Mystery at the Wildlife Preserve [1]
- Suspense at the Wildlife Preserve [2]
- Dino Holmes Series [3]
- Sickness in SmartPolis [4]
- Sofia: Bad air quality on January 20 [5]
- ISSS608 Visual Analytics and Applications [6]


