ISSS608 Assign Pu Yiran-Task 3
|
|
|
|
|
Task 3 |
Meteorological Factors in Sofia City
The meteorological measurements were captured daily by Sofia airport, including humidity, tempreture, pressure, precipitation and wind speed. Combined with EEA data, we are able to discover some relationships between meteographical factors and PM10 levels.
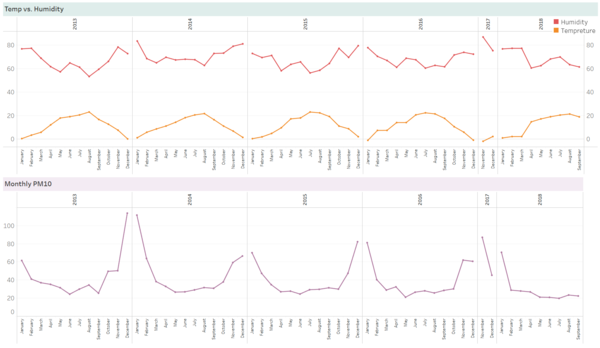
Based on insights from previous sections, winters has the highest PM10, which can be proved from below visualization.
Apparently, in Sofia, during one year, tempreture tends to start dropping from August, when PM10 level tends to start increasing. In December and January, which are the coldest two months, Sofia is also suffered from heavy PM10.
Humidity is also highly related tempreture and PM10. In coldest months, daily relative humidity is highest during the year, where as in warmer months, humidity level is relatively lower.
As a result, high PM10 level could be the effect of low tempreture and high humidity when the burning of fossil fuel tend to increases and the meteographical condition keeps micro-particles floating in the air.
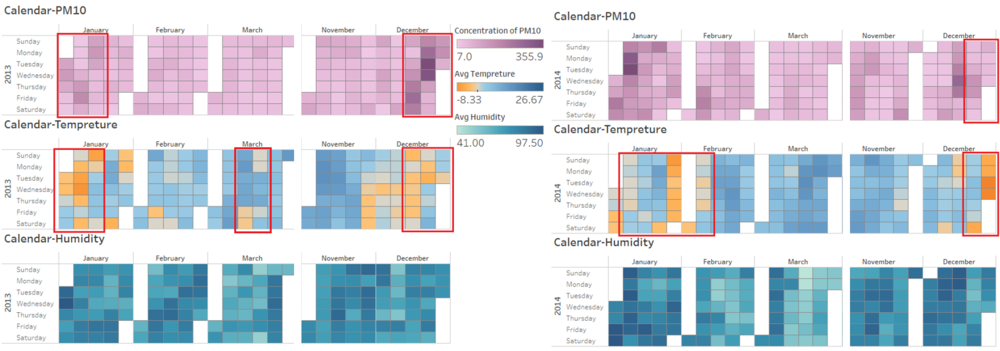
However, from below calendar view, it also can be found that, low temperature doesn’t always lead to high PM10. As highlighted in below, certain days had extremely low temperature whereas PM10 was not the highest. Thus, PM10 is not all triggered by low temperature, but there could be multiple meteorological factors.


