ISSS608 2018-19 T1 Assign Cao Xinjie Task2
|
|
|
|
|
|
|
|
Contents
The Sensors’ Coverage, Performance, and Operation
Data Overview
After using R to join two data and using the geohash package to get the latitude and longitude.
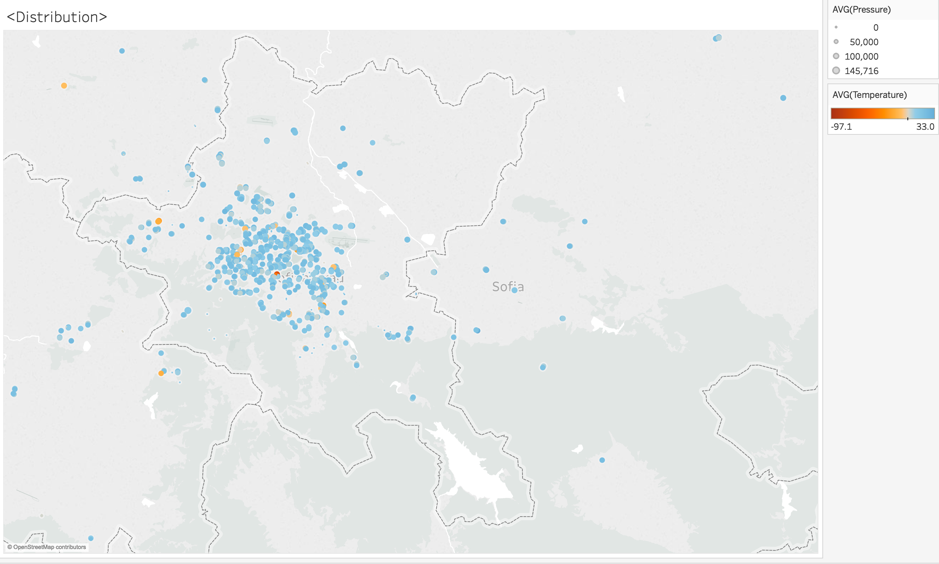
The figure is about the geographical distribution of all the sensors. The sensors can detect the Humidity, PH10, PH2.5, Pressure, and Temperature. In the figure1 we can know that sensors are spread across the country and Sofia. The center part of Sofia has the highest density, but around the center the sensors’ density is low. Some part of the Sofia cannot be detected like the northeast part and south part. The sensors are not working properly all the time, in the figure1 we use color to measure the Temperature and size to measure the Pressure. The temperature ranges from -97.1 to 33, the temperature is impossible to below -40 degree. The pressure also has a problem, because the normal pressure is about 100000, but some sensors’ average pressure is below 60000 which is unreasonable for the air pollution sensor.
Time Heatmap
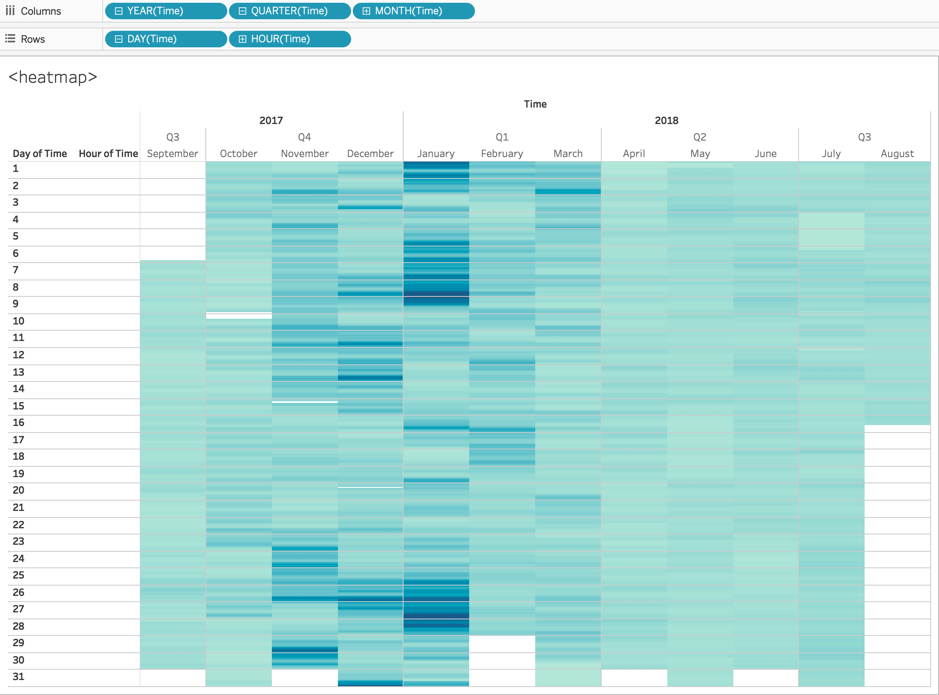
The figure below is a heatmap of the date and time in this year and we put the P1 in the color measurement. The darker the color the heavier air pollution.In the figure2 we can know that there are some hours the sensors are not working like 10 Oct in 2017.
Special Day
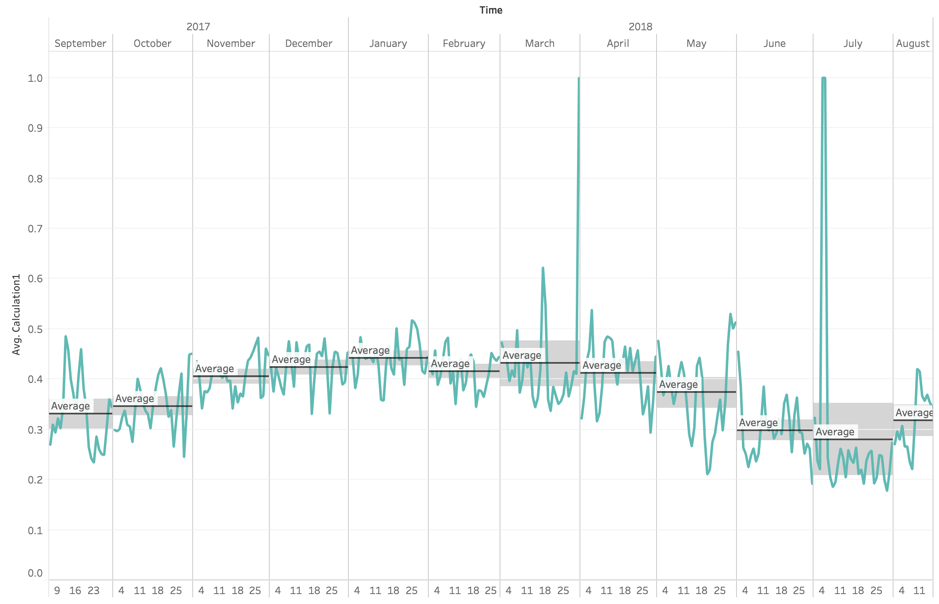
We decided to create a new calculation in Tableau: (P1-P2)/P1. We put the new calculation in y-axis and time is x-axis. After adding the confidential interval, we can know that in the March and July, there is some unexpected value of P1.
Wrong Numbers
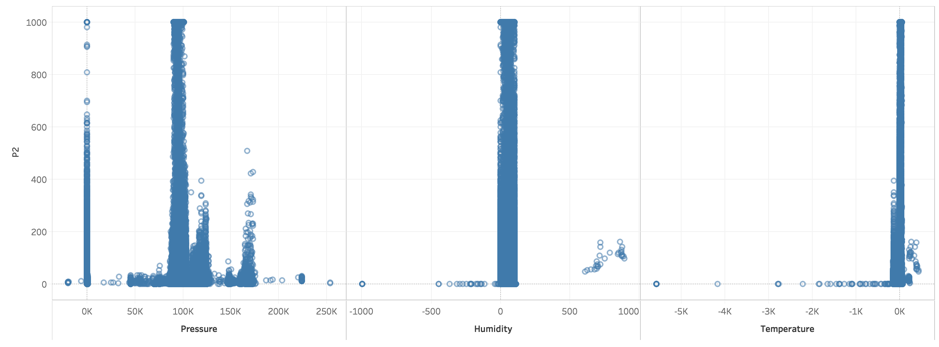
This figure is to see the distribution of Pressure, Humidity, and Temperature. You can clearly see the particular data that is incorrect. There are many missing value in Pressure. And the negative Humility is wrong. The high negative temperature which is not normal is also wrong data.
Air Pollution Analysis
Heatmap of P1&P2
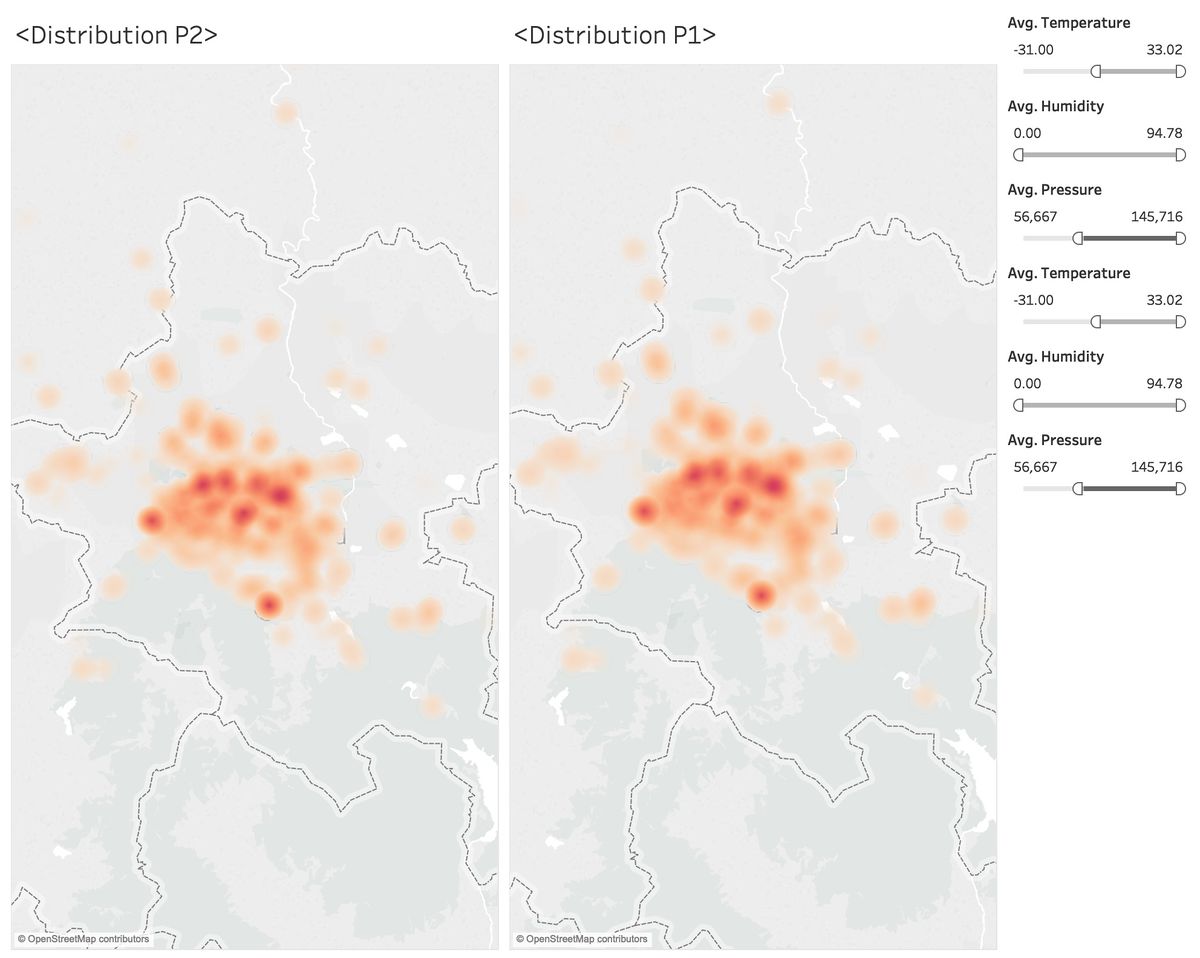
The figure is two heat maps of the distribution of air pollution. We use the filter to delete the wrong data. Through these two maps, we can know that the center part of Sofia has the highest air pollution. Meanwhile, the south part of Sofia also has a heavy air pollution. The air pollution around Sofia is not heavy.
