From Visual Analytics and Applications
Jump to navigation
Jump to search
 Air Polution in Sofia, Bulgaria
Official Air Quality Measurements
A Typical Day
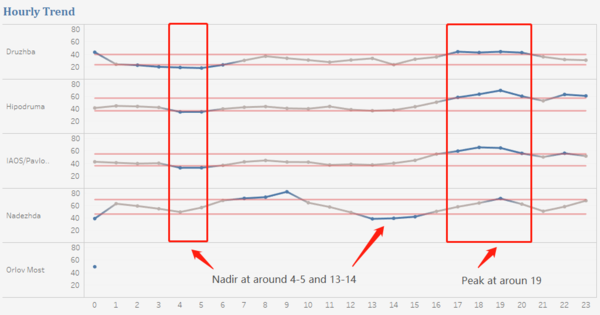
The graph on the right show the hourly trend from 2013 to 2017. Sicne we dont have enough houghly data during this period, the hourly trend reflects mainly the concentration of the last month of 2017.
From the graph we can notice that the PM10 concentration reaches to a nadir at around 4-5 and 13-14 and to a peak at around 19 on average.
And among the four stations that have daily data, readings from the station of Druzhba are lowest on average, whose lowest readings are about half of other stations' lowest concentration and highest readings is a bit higher than other stations' lowest readings.
|
|
|
|
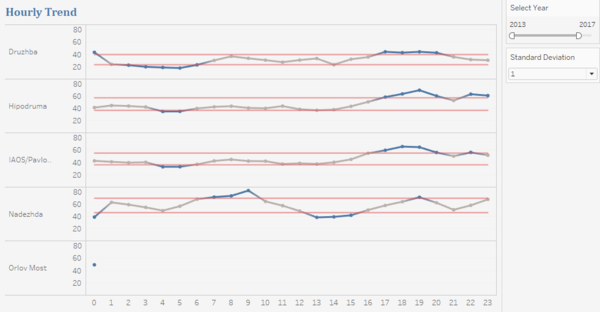
The Hourly Trend graph shows the average hourly PM10 concentration of each station.
- Hover the mouse over each dot to see the average concentration during a certain time period
- Slide the sidebar to select the year to view
- Select the standard deviation from the drop-down list
- Click the station names to highlight the station location on the Map
Parameter created:
- Standard Deviation: to control the number of standard deviation
Calculation Fields created:
- Upper Bound: to draw the upper bound
- Lower Bound: to draW the lower bound
- Outlier: to judge whether a value exceeds the bounds
|
|
|
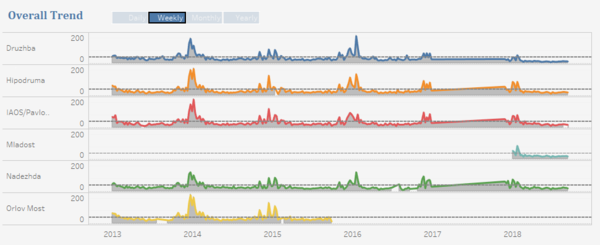
The Overall Trend graph shows the trend of each station according to the date granularity selected.
- Click the blue boxes to adjust the date granularity
- The reference line shows the value of 50 which is the EU hourly standard PM10
|
Operation of Stations
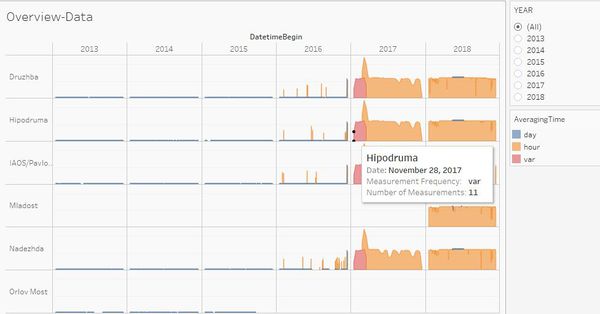
First, as mention in the Data Exploration part, we only have daily data from 2013 to 2015, hourly data from the end of November in 2017 onwards. Missing data affect us explore the hourly trend before the end of November in 2017. And we found some interesting trends from the analysis above, we would be able to better validate the findings if we have more historical data.
And we can also notice that before November 28 there is no data in the year 2017, which also affects our analysis.
|
|
|
|
The Hourly Trend graph shows the average hourly PM10 concentration of each station.
- Hover the mouse over each dot to see the average concentration during a certain time period
- Slide the sidebar to select the year to view
- Select the standard deviation from the drop-down list
- Click the station names to highlight the station location on the Map
Parameter created:
- Standard Deviation: to control the number of standard deviation
Calculation Fields created:
- Upper Bound: to draw the upper bound
- Lower Bound: to draW the lower bound
- Outlier: to judge whether a value exceeds the bounds
|
|
|
The Overall Trend graph shows the trend of each station according to the date granularity selected.
- Click the blue boxes to adjust the date granularity
- The reference line shows the value of 50 which is the EU hourly standard PM10
|
Citizen Science Air Quality Measurements
|
|
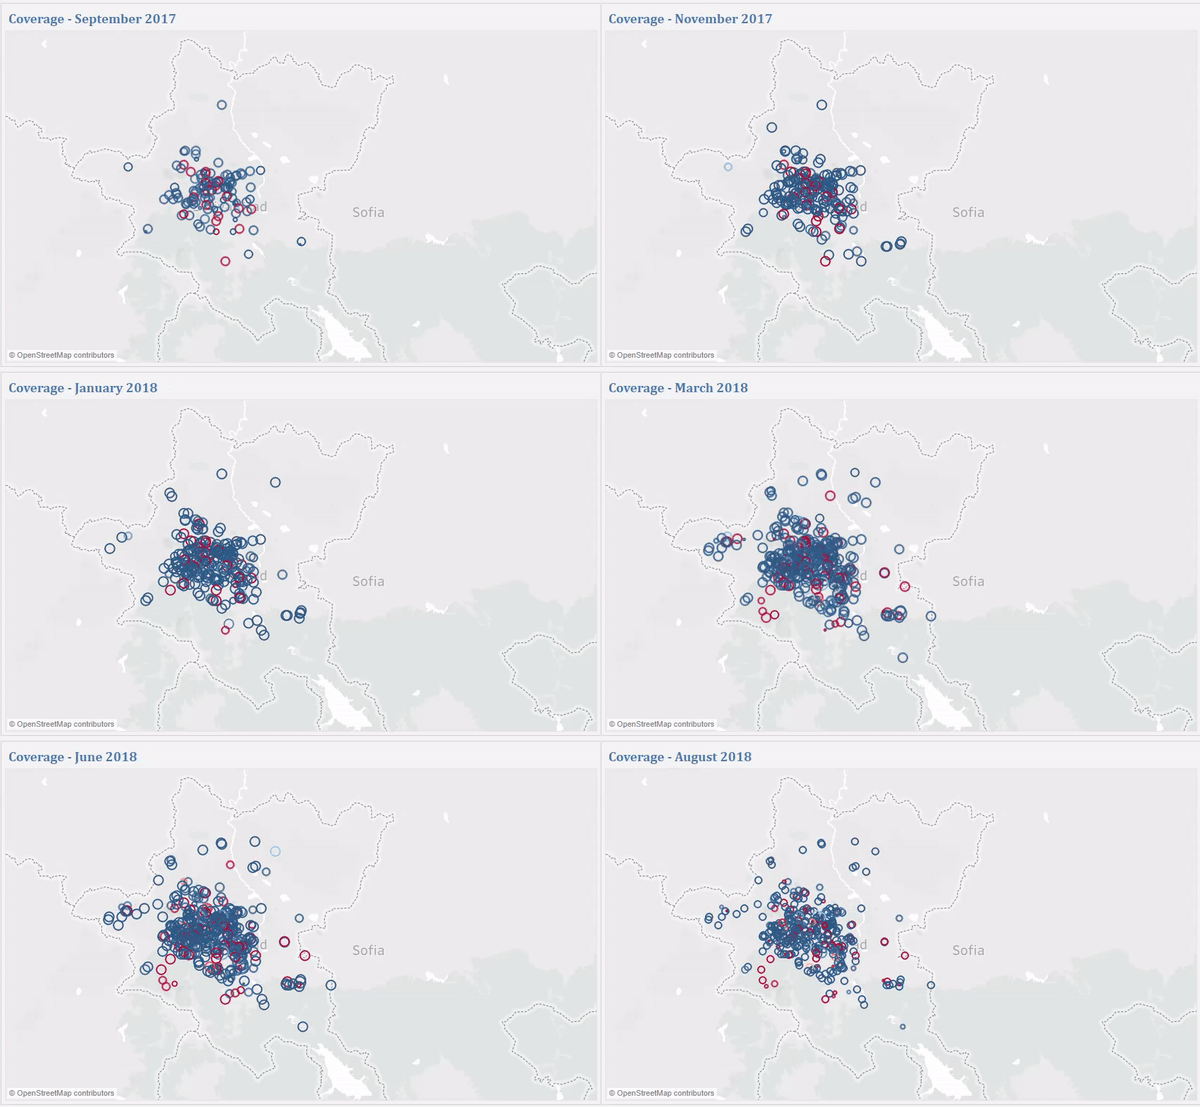
The Coverage Map shows the citizen sensors' coverage.
- The color of circles shows the percentage of anomalies with red indicating high percentage of anomalies
- The size of circles shows the number of measure records
- Click from the Anomalies list to select the well-operated or badly-operated sensors
- Click the play button to view the animation of sensors' operation over the months
- Click the red circles to view the anomalies details on the Anomalies graph and the location on the Concentration Map
- Hover the mouse over each circle to view the average hourly PM10 and PM2.5 concent
|
|
|
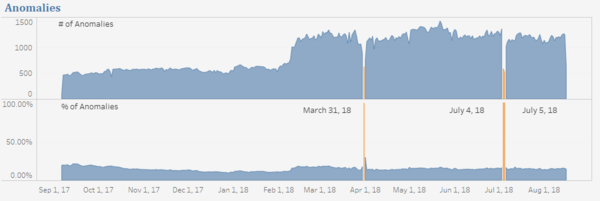
The Anomalies graph shows the number of anomalies and the percentage of anomalies over the time period.
- Hover the mouse over each dot to view the detail of anomaly
- Click a certain dot to view the coverage of that particular day
- Click a certain dot and select True from the Anomalies list, and hover the mouse over the circles on the Coverage Map to view the anomaly details
|
|
|
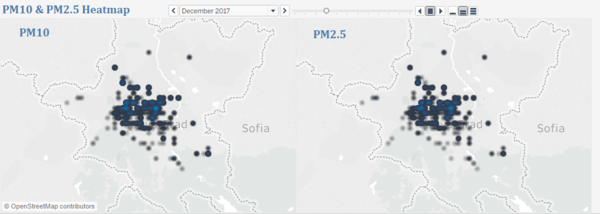
The PM10 & PM2.5 Heatmap shows the concentration change over the time period.
- Click the play button to play the animation
|

