ISSS608 2018-19 T1 Assign Cao Xinjie Task1
|
|
|
|
|
|
|
|
DATA OVERVIEW
After joining all the data together, we can find out the date of data is from 2013-01-01 to 2018-09-13. The air quantity has three data types (day, hour, var), but the hour data start from 2015. The Sofia has six Air quantity stations (40, 50, 52, 54, 73, 79), each station has different its own location, altitude and other information. The station 40A, 50A and 52A are background air pollution, the other three stations are traffic pollution.
DATE AVERAGE DATA
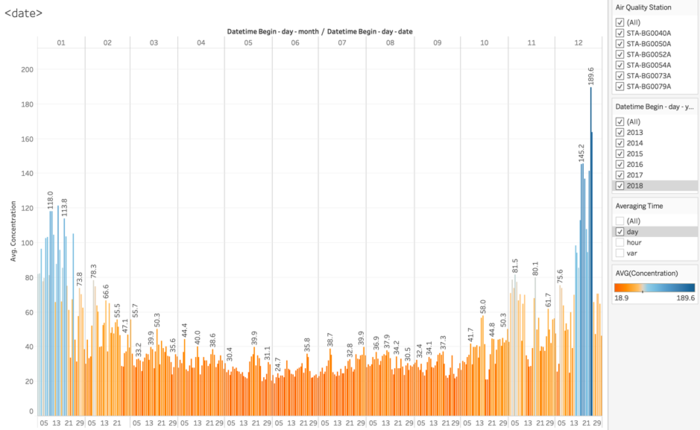
The following image shows the date average air quality in five years, x-axis means all the date in one year, y-axis means the air quality index. we can find out the during Dec and Jan the air pollution increases a lot than the other month, which is obviously.

