ISSS608 Assign Pu Yiran-Data Preparation
|
|
Data Preparation |
|
|
|
Contents
Datasets Overview
Official Air Quality Datasets (EEA)
In urban area of Sofia city, there are 6 air quality monitoring stations, named as Nadezhda (BG0040A), Hipodruma (BG0050A), Druzhba (BG0052A), Orlov Most (BG0054A), IAOS/Pavlovo (BG0073A) and Mladost(BG0079A), monitoring concentration of air pollutant PM10.
The dataset consists of concentration of PM10 measured daily/hourly in 6 years (2013-2018), by 6 stations. Additional information about each monitoring station, such as geo-location is also provided.

Citizen Science Air Quality Data (AirTube)
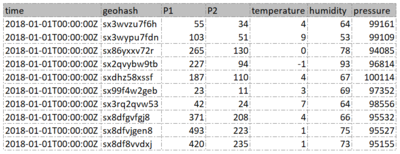
In this dataset, concentration of pollutant PM10 and PM2.5, humidity, pressure and temperature have been measured hourly from 538 sensors located across Bulgaria in 2017 and 2018. Geo-location is encoded in geohash format.
PM10 and PM2.5 are named as P1 and P2 in given data.
Meteorological Measurements and Topographic Data
- Meteorological measurements have been monitored daily at Sofia Airport (longitude= 42.6537, latitude= 23.3829 and altitude= 595 metres) from 2012 to 2018. Meteorological measurements include temperature, humidity, wind speed, surface pressure, precipitation volume and visibility.
- Longitude, latitude and elevation of 196 geo-point in Sofia capital city are given in topographic data.
Data Preparation
EEA Dataset-Discover and fix inconsistent time interval of measurement
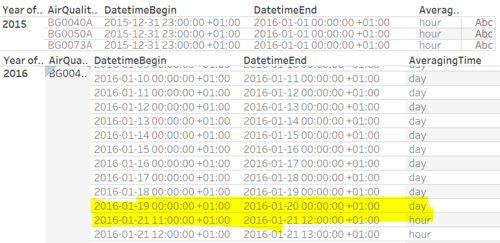
For year 2013 and 2014, concentration of PM10 is given as daily average. However, in 2015,2016 and 2017, data of certain days is given in hourly average. In 2018, data is all given in hourly average.
To analyse the past the most recent patterns of PM10 in Sofia city, data of 2013-2017 has been aggregated to daily average and merged in R. Data of 2018 remained hourly average.

EEA Dataset-Group 24 hours into 4 time periods
As hourly data of 2018 is given, we will be able to find out how air quality is changing during one day, to make which more realistic, 24 hours of a day are split into 4 time periods—before dawn, morning, afternoon and evening, by using below formula.

Airtube Dataset-Decode geohash into Long-Lat format
Since Tableau is not able to identify geohash format, we need to decode geohash into corresponding longitude and latitude in R. The package used for decoding geohash is ‘geohash’.


