Difference between revisions of "ISSS608 2018-19 T1 Assign Qiao Xueyu Visualization"
Jump to navigation
Jump to search
Xyqiao.2017 (talk | contribs) |
Xyqiao.2017 (talk | contribs) |
||
| Line 83: | Line 83: | ||
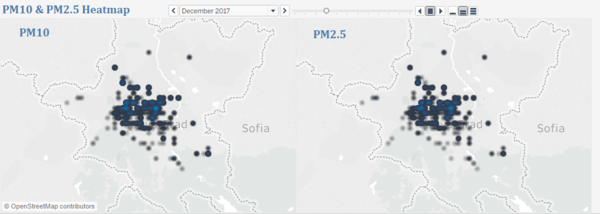
|| The PM10 & PM2.5 Heatmap shows the concentration change over the time period.<br> | || The PM10 & PM2.5 Heatmap shows the concentration change over the time period.<br> | ||
* Click the play button to play the animation <br> | * Click the play button to play the animation <br> | ||
| + | |} | ||
| + | == Air Quality & Other Factors == | ||
| + | {| | ||
| + | |- style="vertical-align:top;" | ||
| + | | | ||
| + | [[File:Factor1.png|600px|frameless|left]] | ||
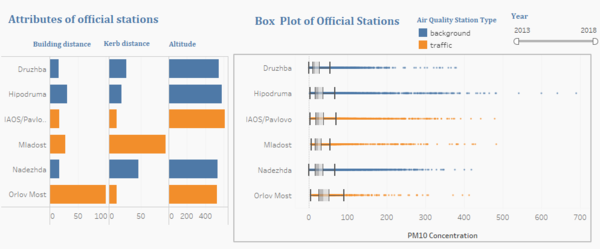
| + | || The graph on the left helps us to explore the relationship between PM10 concentration and attributes of them like distance to curb, distance to building and altitude.<br> | ||
| + | * Click the name of each station to highlight the other graph<br> | ||
| + | * Slide the slider to view the values of different years | ||
| + | |-style="vertical-align:top;" | ||
| + | | | ||
| + | [[File:Fact2.png|600px|frameless|left]] | ||
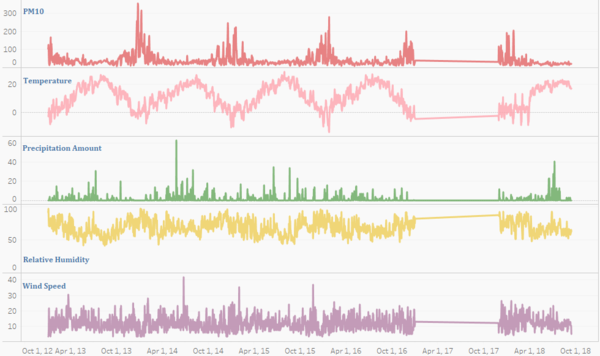
| + | || The line charts of meteorological variables help us explore the relationship between meteorological factors and pollutant concentration. | ||
|}<br> | |}<br> | ||
Revision as of 10:18, 18 November 2018
|
|
|
|
|
|
Official Air Quality Measurements
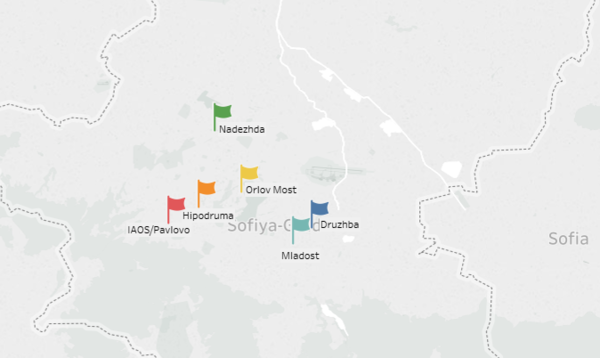
The Map shows the distribution of official stations.
| |
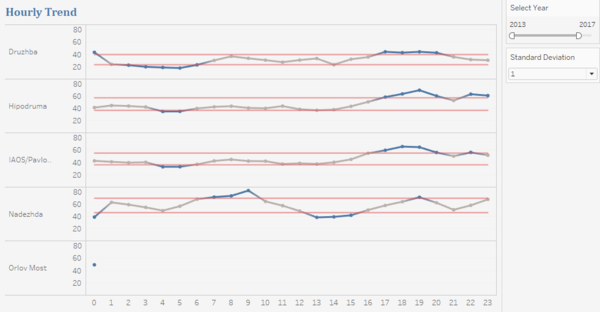
The Hourly Trend graph shows the average hourly PM10 concentration of each station.
Parameter created:
Calculation Fields created:
| |
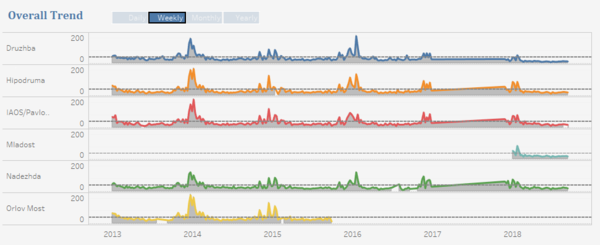
The Overall Trend graph shows the trend of each station according to the date granularity selected.
|
Citizen Science Air Quality Measurements
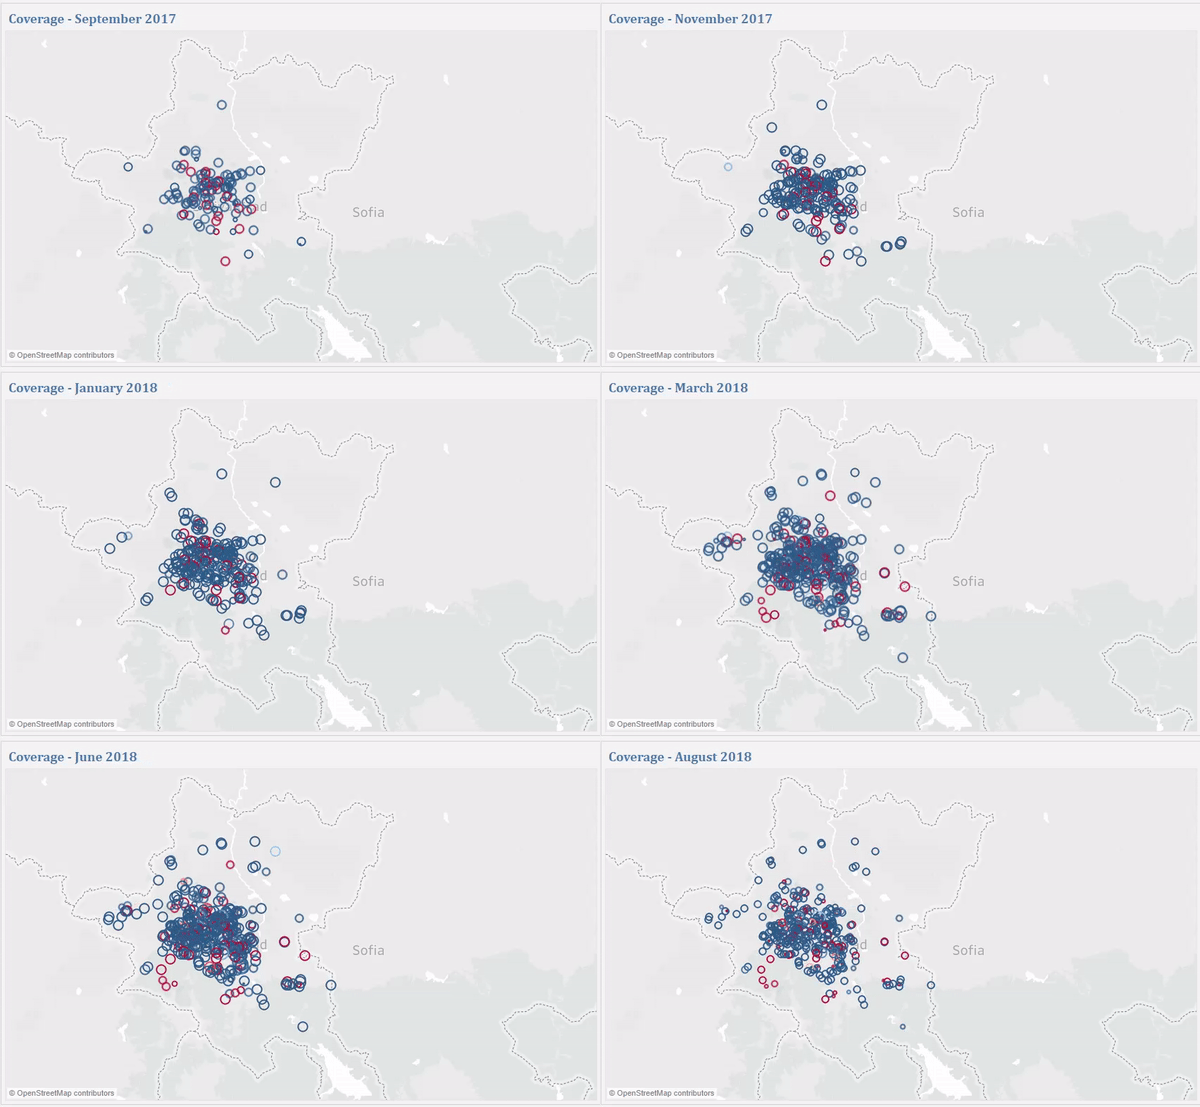
The Coverage Map shows the citizen sensors' coverage.
| |
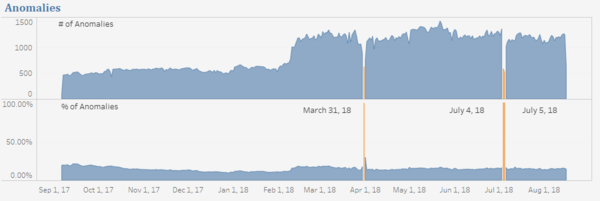
The Anomalies graph shows the number of anomalies and the percentage of anomalies over the time period.
| |
The PM10 & PM2.5 Heatmap shows the concentration change over the time period.
|
Air Quality & Other Factors
The graph on the left helps us to explore the relationship between PM10 concentration and attributes of them like distance to curb, distance to building and altitude.
| |
| The line charts of meteorological variables help us explore the relationship between meteorological factors and pollutant concentration. |
