Difference between revisions of "ISSS608 2018-19 T1 Assign Oh Zhen Yao Matthias Task 2"
Jump to navigation
Jump to search
| Line 38: | Line 38: | ||
==2. P1 (PM10) Pollution Readings== | ==2. P1 (PM10) Pollution Readings== | ||
1. There are 25,519 outliers with >360μg/m3 PM10 readings (the maximum observed average PM10 reading from the official EEA data).<br>[[File:T2_Readings_1.png|center|1000px|Univariate Outliers]] | 1. There are 25,519 outliers with >360μg/m3 PM10 readings (the maximum observed average PM10 reading from the official EEA data).<br>[[File:T2_Readings_1.png|center|1000px|Univariate Outliers]] | ||
| − | 2. Average hourly PM10 readings seem to be better the further away the sensors are from the city center.<br>[[File:T2_Readings_2.gif|center| | + | 2. Average hourly PM10 readings seem to be better the further away the sensors are from the city center.<br>[[File:T2_Readings_2.gif|center|700px|None]] |
* Note that the colour scale has a lower bound = 0μg/m3, center = 180μg/m3, and upper bound = 360μg/m3. | * Note that the colour scale has a lower bound = 0μg/m3, center = 180μg/m3, and upper bound = 360μg/m3. | ||
* Hexa-binning was used to provide a better, less-granular overview of the PM10 readings over the different hours of a day. | * Hexa-binning was used to provide a better, less-granular overview of the PM10 readings over the different hours of a day. | ||
Revision as of 19:51, 17 November 2018
 Sofia City: Air Quality Analysis
|
|
|
|
|
I. Task Summary
Scope:
- PM10 (assumed to be P1 variable in the dataset) pollution measurements across Sofia City from 2017-2018, recorded using Citizen Science sensors.
Objectives:
- Characterize the sensors’ coverage, performance and operation.
- Investigate if some parts of the city show relatively higher air pollution measurements than others. Further, investigate if these differences time dependent.
II. Insights
1. Sensors
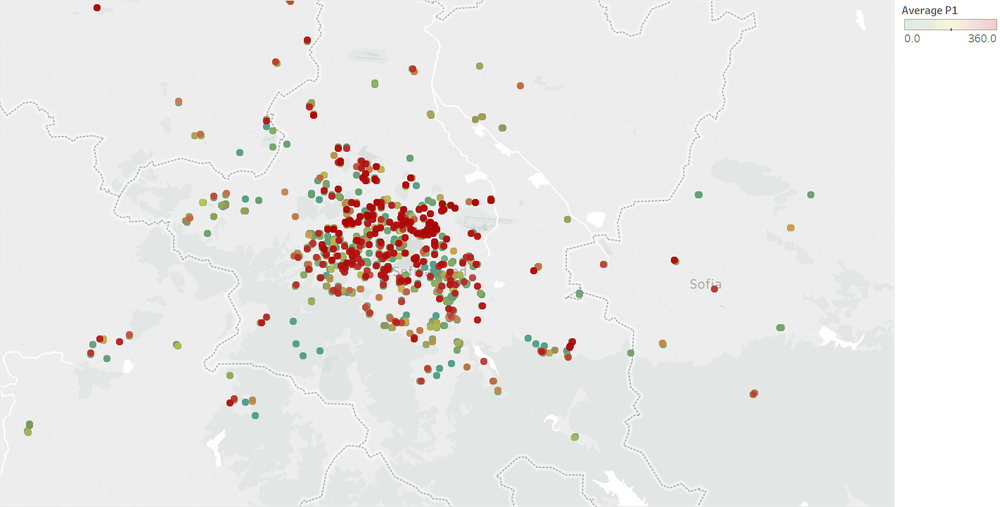
1. Sensors are nucleated at the city centre:

- There is a better horizontal than vertical coverage, with sparse sensors distributed across the east to the west, and no sensors at the northern and southern ends of the city.
- The distribution of sensors will result in PM10 readings that may not be representative of air pollution measures at the northern and southern parts of Sofia City.
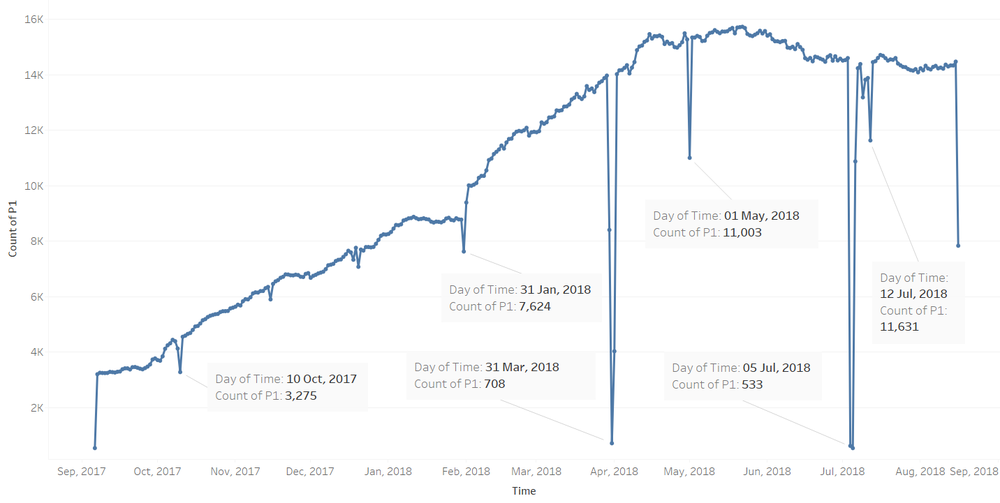
2. There were 6 days identified with noticeable decreases in 'p1' record counts:
- There could be potential faults with the Citizen Science sensors, that could affect the collection and analysis of time-series air pollution measurements.
2. P1 (PM10) Pollution Readings
1. There are 25,519 outliers with >360μg/m3 PM10 readings (the maximum observed average PM10 reading from the official EEA data).

2. Average hourly PM10 readings seem to be better the further away the sensors are from the city center.

- Note that the colour scale has a lower bound = 0μg/m3, center = 180μg/m3, and upper bound = 360μg/m3.
- Hexa-binning was used to provide a better, less-granular overview of the PM10 readings over the different hours of a day.
- This is a GIF. To access an interactive version of the full animation across all the hours in a day, please refer to Matthias' Tableau Public.
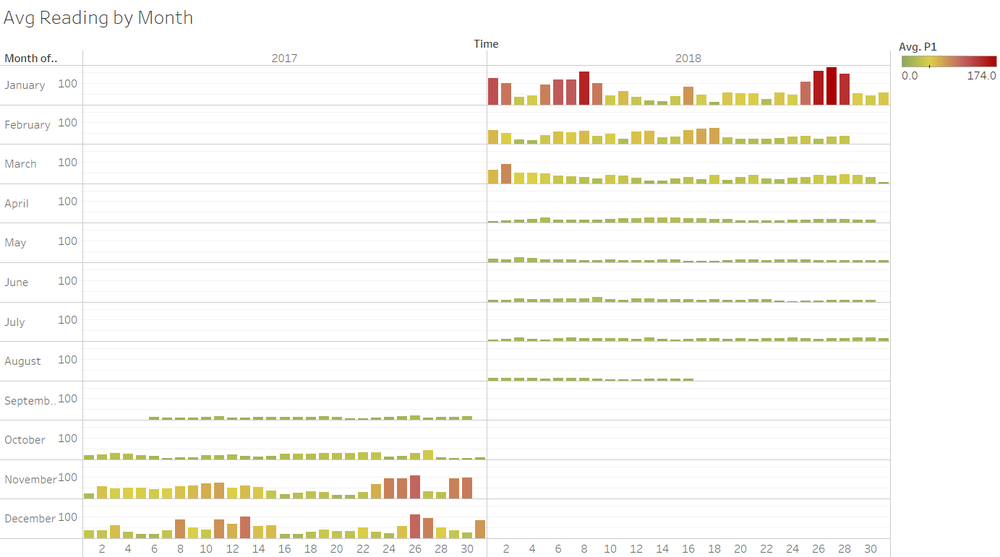
3. Monthly PM10 readings seem to peak from November to February:

- Similar to the EEA data used in Task 1, this could be due to increased power consumption for heating in winter.
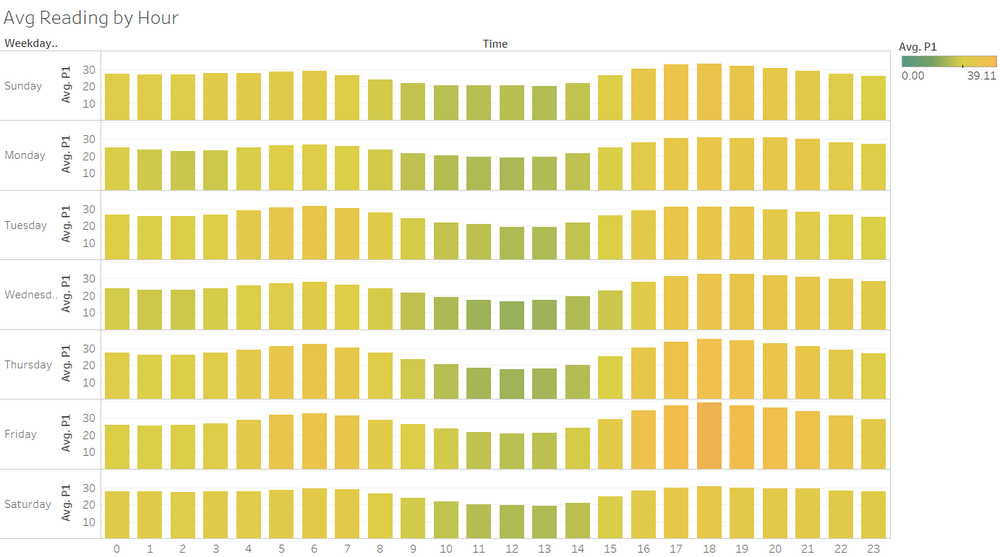
4. Hourly PM10 readings seem to be better in the middle of the day from 11:00 to 14:00:
