ISSS608 2018-19 T1 Assign Oh Zhen Yao Matthias Task 1
 Sofia City: Air Quality Analysis
|
|
|
|
|
I. Task Summary
Scope:
- PM10 pollution measurements across Sofia City from 2013-2018.
Objectives:
- Visualize a typical day look like in Sofia City to identify trends of possible interest related to air quality.
- Identify anomalies in the official air quality dataset, and describe their effects on the underlying analysis of potential problems to the environment.
II. Insights
1. Anomalies
1. Inconsistent recording methods:
- The default records are daily averages. From 2016 onwards, hourly average records were taken in addition to daily averages.
- Hourly average records were inconsistently recorded in 2016 across 4 of 6 stations:
- An unknown “var” method was used to record average PM10 concentrations in 2017 - these data rows are excluded from this analysis exercise.

2. Missing data:
- In 2017 there were no daily and hourly records from 1 January to 30 November across all 6 stations.
- Station BG0054A's last record is on 1 October 2015
- Station BH0079A only started data collection in 2018.
2. Trends
1. PM10 daily average concentrations peak at every start/end year (Nov-Feb), with the latest peak from Nov 2017 - Feb 2018 being lower than preceding peaks:

- This could be due to the need for heating in winter, which is an activity that consumes a lot of power, thus resulting in higher volumes of coal being burnt in Sofia City's 2 thermal power stations.
- Further, contrary to reports, the daily average is actually below the EU threshold of 50 μg/m3.
2. PM10 concentrations at each station have a slight overall decreasing trend across the years, notwithstanding results from station BG0079A which only has 1 year (cycle) of data:

- Further, the air quality at BG0052A had the best improvement across all stations.
3. In particular, the western regions have a greater average PM10 concentration than the eastern regions over the duration of 2013-2018:

- Please refer to Matthias' Tableau Public for the interactive version of the plots used in points 2. and 3.
2. Taking a closer peek at the peaks (November-February), the 2013/2014 and 2014/2015 peaks are bi-modal; 2015/2016 and end-2016 peaks seem more volatile; 2017/2018 peak looks to be tri-modal (excluding BG0079A):

- Please refer to Matthias' Tableau Public for the interactive version of this plot.
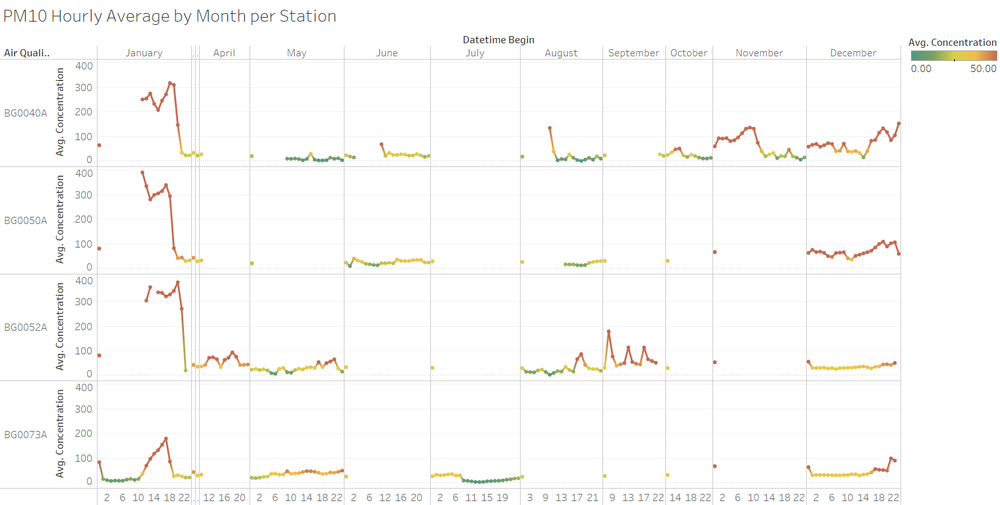
3. Based on hourly records from Jan - Sep 2018:

- PM10 concentration seem to peak at 9am in the month of January.
- Interestingly, BG0040A recorded 2 mini-peaks in the middle of April and May 2018.
- All stations seem to record a dip in PM10 concentrations in the middle of the day from February to September 2018, with the exception of BG0052A (which seems to record the opposite) and the 2 aforementioned mini-peaks.
4. PM10 daily average concentrations look lower from Nov 2017 to Sep 2018 compared to preceding years:

- With the addition of 2017 and 2018 PM10 daily averages, the plot on the right become visually 'greener' than the plot on the left that only has PM10 daily averages from 2013 to 2016.