ISSS608 2018-19 T1 Assign Oh Zhen Yao Matthias Task 3
Jump to navigation
Jump to search
 Sofia City: Air Quality Analysis
|
|
|
|
|
I. Task Summary
Scope:
- Data from Tasks 1 & 2 in conjunction with topographical and meteorological data.
Objective:
- Identify and reveal any relationships between the topological and meteorological factors and the air quality measurements detected in Task 1 and Task 2
II. Insights
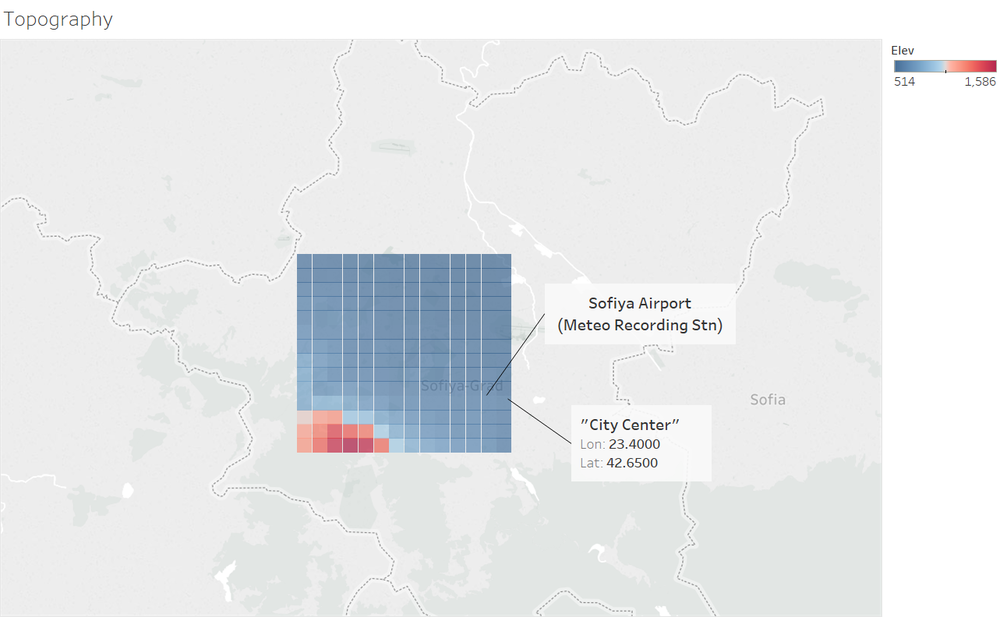
1. Topography:

- Southern, particularly South-Western parts of Sofiya-Grad is of a higher altitude are likely to be mountainous (>600m above sea level).
- Based on visual approximation, a city center was identified and used as a point of reference {Latitude: 23.40, Longitude: 42.65}.
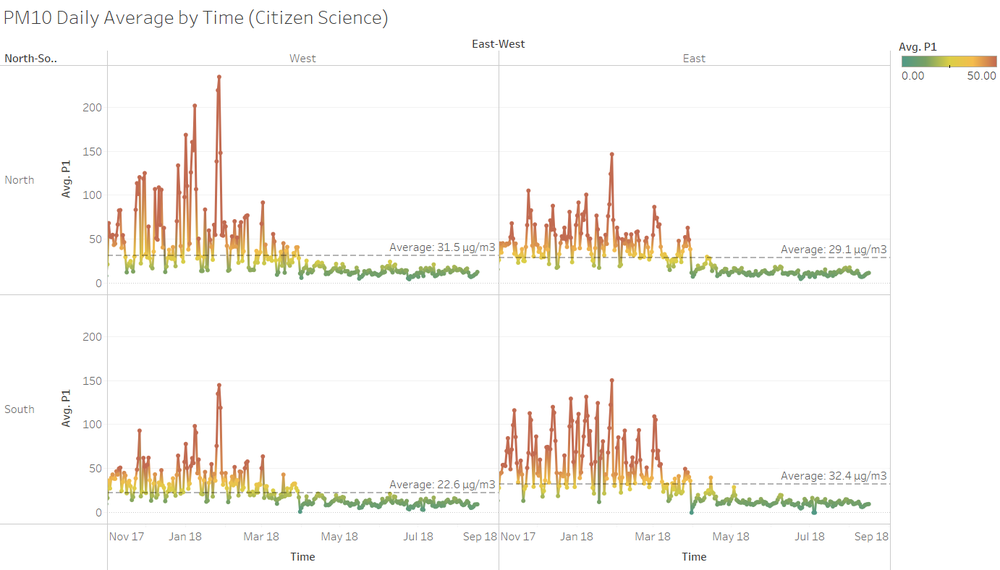
- With respect to the city center, it was noted that South-Western parts of Sofia City, which have the highest elevation measurements, also have the lowest PM10 daily averages:

- This could be due to mountains forming a natural physical barrier against particulate matter.
2. Meteorology:
| Official PM10 Readings -vs- Meteorological Features (01/01/2013-14/09/2018) |
Citizen Science PM10 Readings -vs- Meteorological Features (06/09/2017-16/08/2018) | |
|---|---|---|
| PM10 Daily Average Readings |
 |
 |
| Meteorological Readings |
 |
 |
- It was noted that of all the meteorological features, temperature had a negative correlation with PM10 readings: As PM10 concentrations increased, temperature readings were observed to decrease.
- This could be due to the need for heating during cold temperatures, thus increasing power consumption and the burning of coal at thermal power stations, ultimately increasing PM10 emissions.
- The following anomalies were also noted during visual analysis:
- As annotated in the plot of meteorological features that was used for comparison against the Official PM10 readings (Row 2, Column 1), there is an outlier spike in average precipitation on 1st November 2016.
- The Visibility meteorological feature was not used because it took on values <= 0km.
III. Critique
Based on the challenges faced in addressing this task with the underlying tool, Tableau, there are several points of critique:
1. No inherent contour plotting facility was available.
2. Tableau does not support the plotting of axes (longitude x latitude x elevation)
3. Separate workbooks had to be used for each dataset as they did not have common keys for joins. This prevents visualizations from being outputted in the same interactive dashboard on Tableau Public.