Difference between revisions of "ISSS608 Assign Pu Yiran-Task 2"
| Line 28: | Line 28: | ||
|} | |} | ||
=<font face="Book Antigua"; size=5>'''Get To Know About Sensors'''</font>= | =<font face="Book Antigua"; size=5>'''Get To Know About Sensors'''</font>= | ||
| − | |||
==<font face="Book Antigua"; size=5>Where did sensors cover</font>== | ==<font face="Book Antigua"; size=5>Where did sensors cover</font>== | ||
[[File:Task2 001.png|650px|right]] | [[File:Task2 001.png|650px|right]] | ||
| Line 45: | Line 44: | ||
</font> | </font> | ||
<br> | <br> | ||
| − | <br><br> | + | <br> |
| + | <br> | ||
==<font face="Book Antigua"; size=5>How did sensors work</font>== | ==<font face="Book Antigua"; size=5>How did sensors work</font>== | ||
<font face="Modern", size=2> | <font face="Modern", size=2> | ||
Revision as of 00:08, 17 November 2018
|
|
|
|
Task 2 |
|
Contents
Get To Know About Sensors
Where did sensors cover
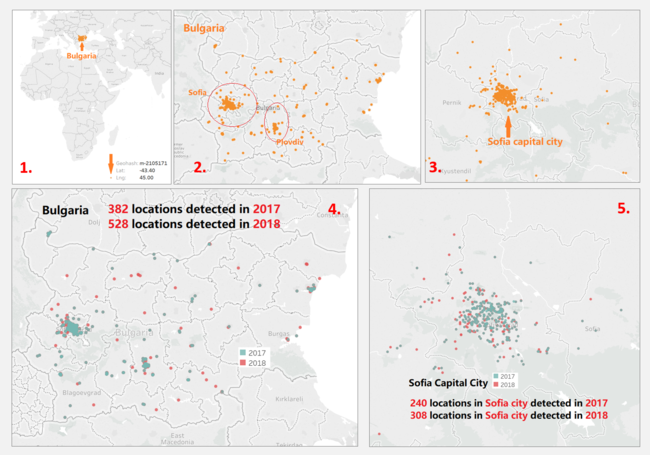
After decoding geohash into corresponding longitude and latitude, we are able to locate all the geohash onto map, each of which represents a sensor’s location. As shown in the first graph, there is one remote point which could be an error and will be excluded in further analysis. In total, there are 538 sensors located across the entire Bulgaria, giving 1,048,574 sensor records of 2017 and 2018.
National-widely, sensors were detecting from 382 locations in 2017 and 528 locations in 2018. In Sofia city, sensors were detecting from 240 locations in 2017 and 308 locations in 2018.
Although the sensors are covering national wide of Bulgaria, most of them are centralized in capital city Sofia, and especially, the central region of Sofia city. A small number of sensors also gathers at Plovdiv, a province near Sofia. At the rest provinces/cities, sensors are evenly distributed.
To perform further analysis on Sofia capital city, a set of all the sensors located in Sofia city is created.
How did sensors work
Although the given time interval of measurement in data is one hour, not all the sensors have been either working well nor giving correct data all the time.
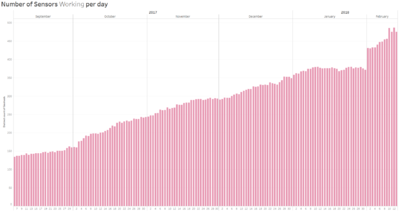
Not all the sensors started working at the beginning — the number of sensors that were working per day was generally increasing during the given time period in data.
Most of the sensors were not working well all the time. As the example given below, even if a sensor was working on a particular day, it might not be working for 24 hours continuously, which makes all the blanks and gaps in the graph.
Even worse, sometimes sensors performed abnormally and gave ridiculous data. Plus, as shown in below, some abnormal status has been lasted for hours and even a few days continuously, which can badly affect some analysis on daily average.
By looking at all the abnormal records, we can find out that most of the error values are the same or in the same range, which can be considered as a systematic breakdown of machines. To make sure the accurate of further analysis, all the error records are excluded.


