ISSS608 2018-19 T1 Assign Wong Yam Yip Task 3 Insights
|
|
|
|
|
|
`
Contents
Correlation with Environmental factors
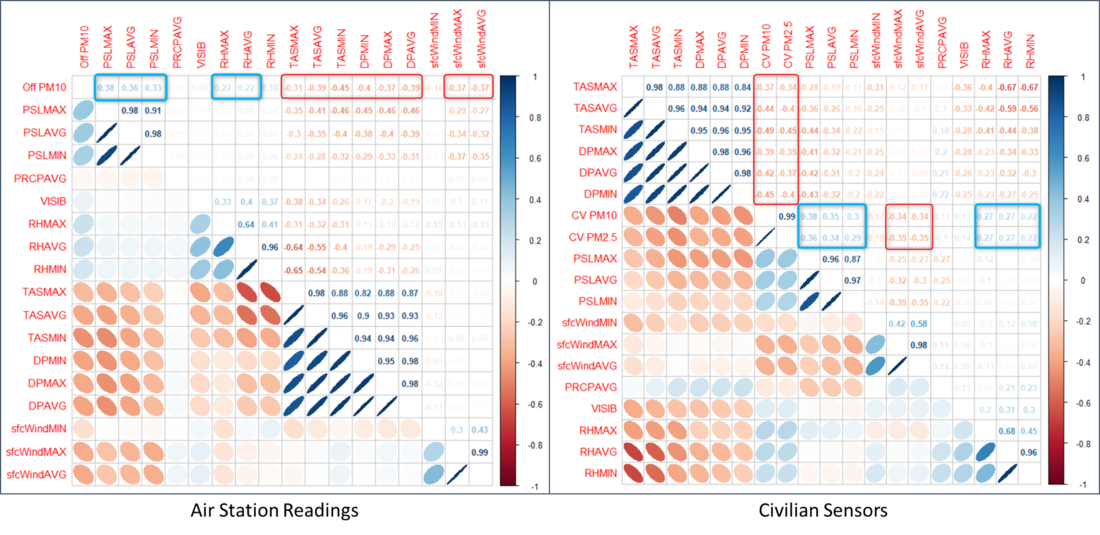
Using corrplot in R Studio, the covariance matrix of air population reading is mapped out as above. For both official air station concentration readings and civilian sensors, PM10 (and PM2.5) is positively correlated to surface pressure (PSL***). The air pollution indicators are also positively correlated to relative humidity (RH***), in a relatively smaller magnitude. Both PM10 and PM2.5 also have higher correlation at higher magnitude of these environment factors. On the flip side, the air pollution indicators are negatively correlated to temperature (TAS***) and dew point temperature (DP***), with stronger correlation at lower temperature. Wind speed (sfcWind***) is also negatively correlated, with stronger at higher wind speed. These findings contradict that from the previous section and further strengthens our doubt on the accuracy and operationality of the civilian sensors.
Energy Sources and Cross-Boundary Effects
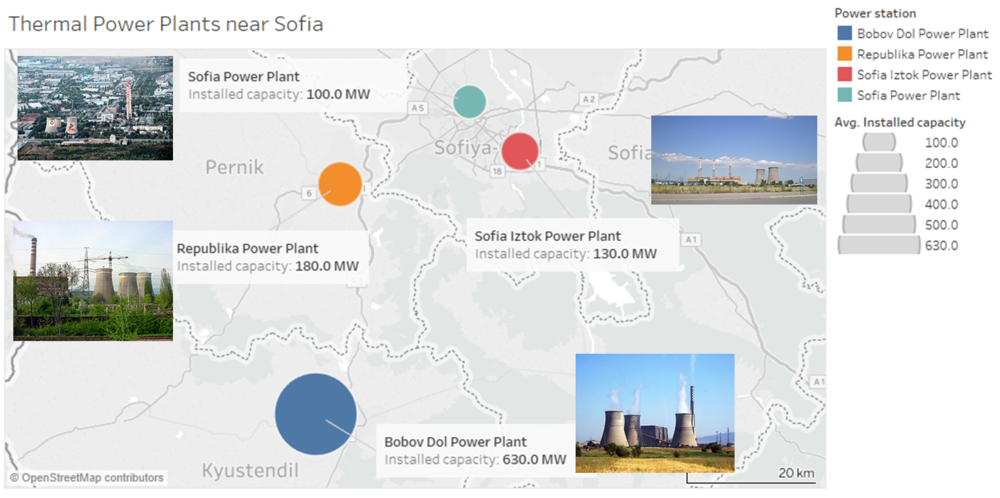
The image above shows the locations of thermal energy plants in and near Sofia City. The Sofia Power Plant is situated right in the middle of the city. This probably explains the high air pollution readings within the center of the city.
To the southeast, on the outskirt of the city, there is also another energy plant, Sofia Iztok Power Plant situated just outside Sofia city. This plant has a higher install capacity of 130MW, compared to 100MW of Sofia Power Plant. It is possible that a significant portion of the city center’s air pollution is a result of the location of these 2 plants.
Further down South-West, there are 2 more energy plants, Republika Power Plant and Bobov Dol Power Plant, just 22km and 51km (less than an hour's drive) away from Sofia city center respectively based on google maps measurements. These energy plants have even higher install capacity. In particular, Bobov Dol Power Plant, has installed capacity of 630MW, more than 6 times that of Sofia Power Plant. Higher installed capacity would mean higher emission of air pollution.
Topology of Sofia
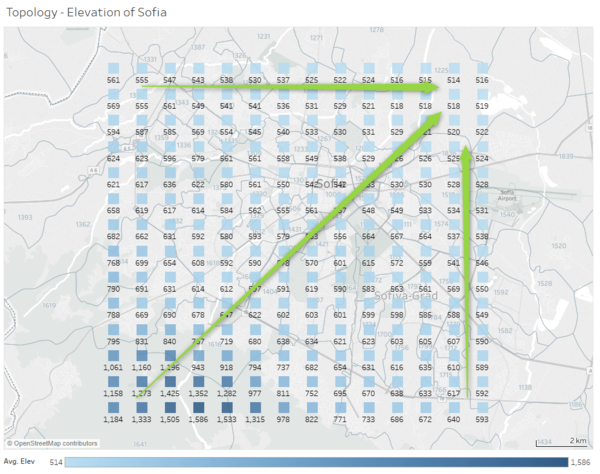
From the above image, when we look at the topology the Sofia City, we can see that the elevation is highest at the South-West corner and the north east corner being the lowest corner. This forms a natural funnel that channels air from the south west to north-eastward. This likely resulted in air pollution from the other 2 energy plants, Republika Power Plant and Bobov Dol Power Plant, to be brought to the city. We can verify this by reviewing wind direction pattern of Sofia city. This might also explains why there were exorbitant readings from civilian sensors at the outskirts, in the South and South-West of the city seen in the earlier section of Task 2.
References
Sofia Power Plant image credit to: Bjoertvedt
Sofia Iztok Power Plant image credit to: Marcian
Republika Power Plant image credit to: ArielR
Bobov Dol Power Plant image credit to: Boby Dimitrov
The Tableau Workbook to the Energy Plant image can be found here
The Tableau Workbook to the Topology image can be found here
Banner image credit to: MarcusObal


