ISSS608 2018-19 T1 Assign Wong Yam Yip Task 1 Insights
|
|
|
|
|
|
`
Contents
Challenges with dataset
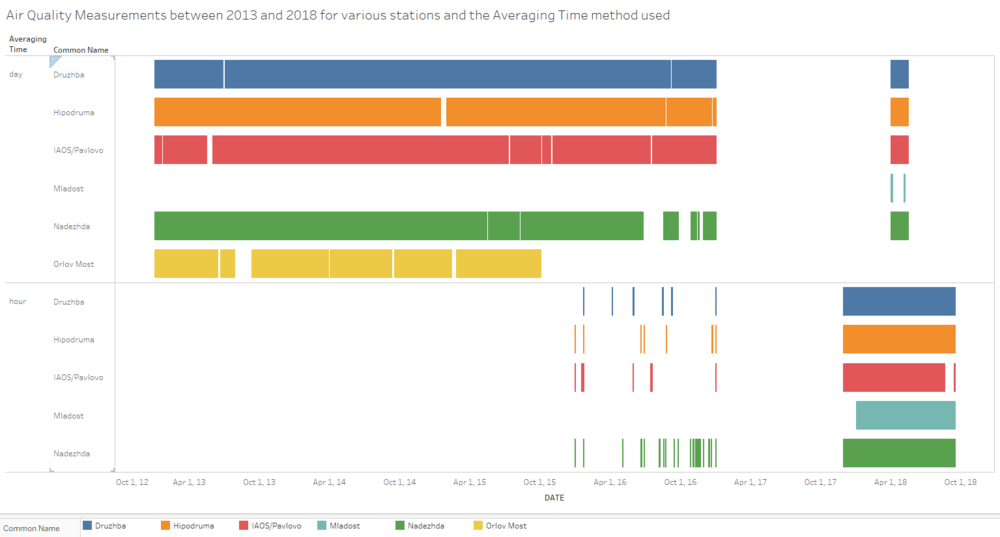
From the above image, it is clear that there is inconsistency and missing values in the dataset. Overall, we can see that there is a switch from using day averaging time method in the past (2013-2016), to using hour averaging time method in the present (2017-2018). There are also various missing pockets of data in the series of time.
By exploring at the data of each individual station, data of Orlov Most is missing from Oct 2015 onwards, while data for station Mladost is only available from Jan 2013 onwards. Additionally, for the other 4 stations, Druzhba, Hipodruma, IAOS/Pavlovo and Nadezhda, there is limited hourly data from 31 Dec 2015 to 31 Dec 2016. Considering how the data is broken in time and switched between day and hour averaging time, this could be a trial period for migration to hourly data. There is also no data from 31 Dec 2016 to 28 Nov 2017, and after which, hourly data is available till the end of period. Daily data again resurfaced for a short period between 15May 2018 to 14May 2018.
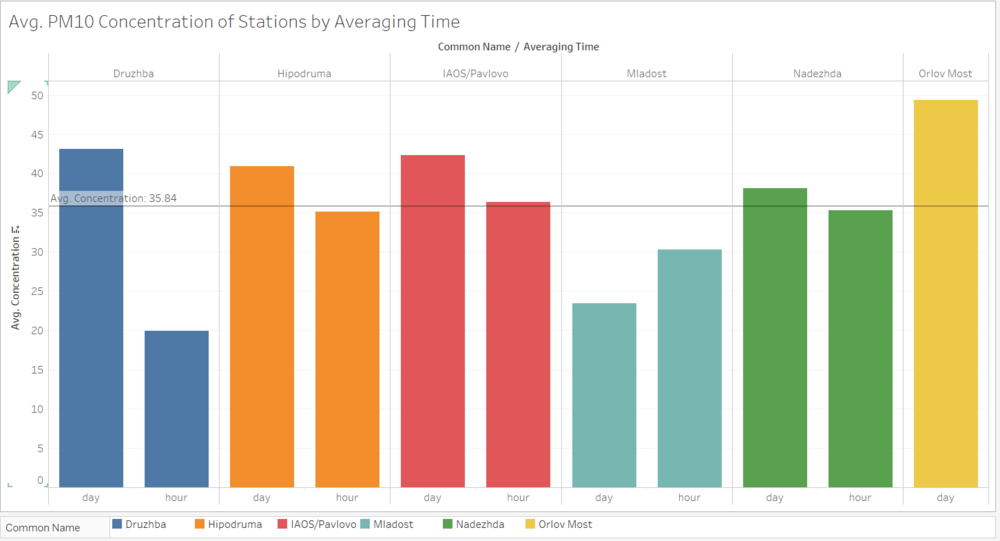
The missing data in time puts a challenge to the accuracy of the measurements when PM10 concentration levels are aggregate by the stations. Furthermore, the inconsistency in ratio of daily to hourly data will affect the comparison between past and present concentrations where variance between past and present could be due to the change in averaging method rather than an actual difference in concentration levels. As we can see below, for the same station, all 4, Druzhba, Hipodruma, IAOS/Pavlovo, Nadezhda stations have higher readings with daily measurements compared to hourly. In particular, Druzhba’s daily average is more than double that of the hourly average. The exception is Druzhba but as mentioned, this station started only in 2018 and there is insufficient daily data to make a significant comparison. Overall the average PM10 concentration is 35.84 µg/m3 for the entire period. These limitations greatly affects the reliability of our analysis
It is also difficult to compare past and present data as there is only less than 1 year of present data. Moreover, station Orlov Most only appeared in the past data while station Mladost appeared only in the present data also affects the validity of the comparison.
Air Pollution: Past and Present
In this section, the air pollution readings from the past and present will be compared. To recap, past readings are recorded between 2013-2016 and present readings are recorded between Nov 2017-2018.
PM10 over Time
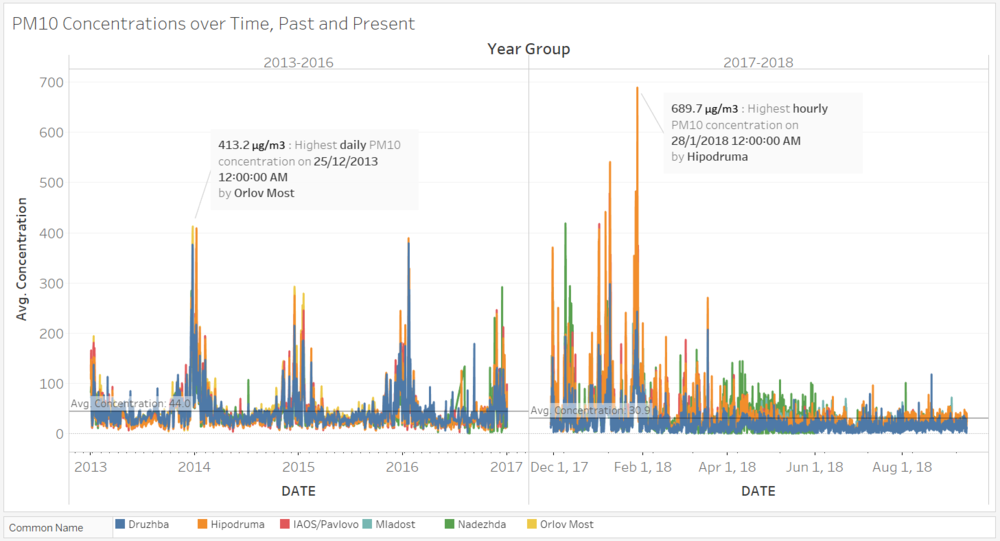
Overall, the average concentration of present, 35.3 µg/m3, is lower than that of the past, 43.0 µg/m3. However, the highest reading recorded in the present, 689.7 µg/m3, is significantly higher than that of the present, 413.2 µg/m3. One possible explanation is that the past data were mainly daily average readings and spikes within the day cannot be captured in the data unlike that of the present.
In the past, there is an obvious trend of seasonal increase in PM10 concentrations in Q1-Q4 each year, rising from September, peaking around December/January. The pollution reading will drop back to the lower levels by March/April, and stay relatively similar through the rest of Q2-Q3.
In the present, concentrations drop from Nov 2017 to Dec 2017 but rises again in Jan 2018. Subsequently, concentrations returned to lower levels 10-30 µg/m3 from Feb onwards. Overall, concentrations readings from the present station Druzhba seemed to be relatively lower than in the past, and compared to the other stations. It would be interesting to know the reason behind Druzhba’s measurement dropped as compared to other stations.
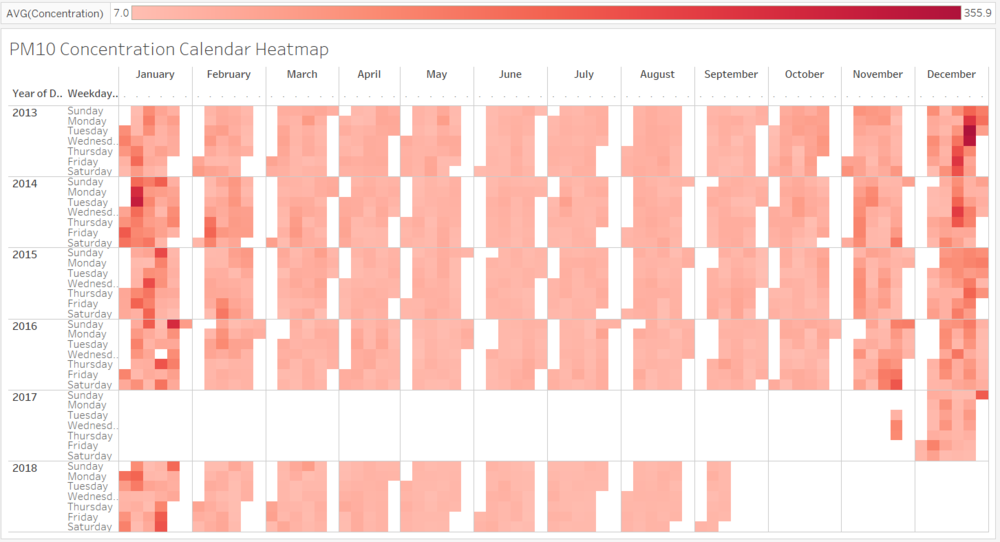
These findings are also evident from the concentration heatmap below where the colour is significantly darker in between Nov – Feb. This is in line with the information that Sofia still uses wood and coal for heating. As the climate gets colder during winter, the increase in burning of these fuels will greatly increase the air pollution levels.
PM10 in a Typical Month
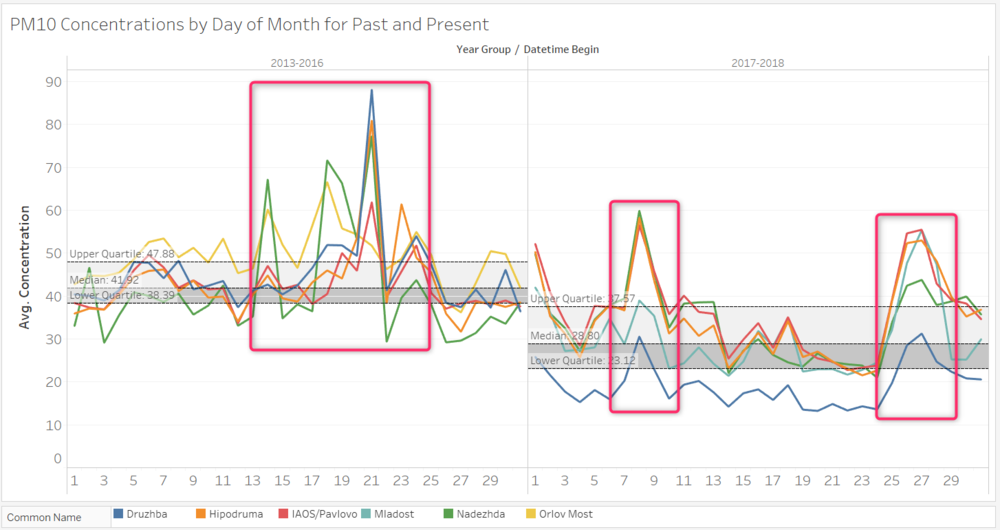
Overall, the measurement quantiles in the past are also relatively higher than the present. The levels of pollution has reduced in 2017-2018, especially for Druzhba (Blue). In the past, there are generally higher PM10 concentration in between 13-25th day of month, spiking on 21st of month. Now, the same period seemed to have lower concentrations while the beginning and end of month seemed to have higher pollution concentrations. This is an interesting point exploring why the past and present seemed to be showing opposite results 11 months apart.
PM10 by Hour on different Days of Week
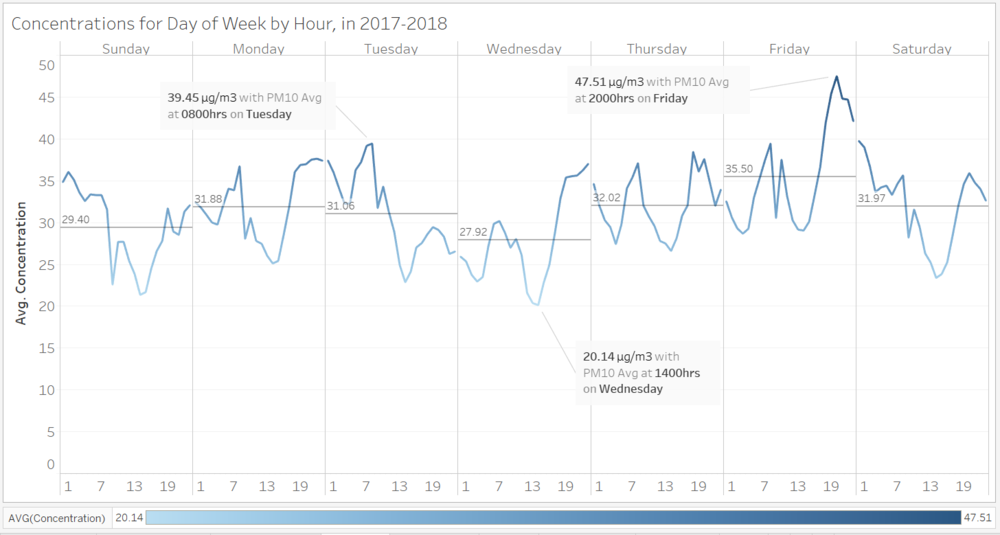
As there is very little hourly data for 2013-2016, it will not be significant to look at the past data, thus we focus on only 2017-2018 hourly data and this is what a typical week would look like.
On a typical weekday (Mon-Fri), PM10 concentration rises from 3am to a peak of at 8am, which is likely attributed to the morning rush with high traffic volume. Concentration drops after that till 2pm, before starting to increase again. Generally the concentration levels peak at 6-8pm and remaining relatively constant till 12am. This is likely due to the after-office-hour traffic. Another interesting thing to note is that the average PM10 reading for weekdays starts from 31.88 µg/m3 on Monday, and drops till 27.92 µg/m3 on Wednesday before peaking again on Friday with an average of 35.5 µg/m3. Friday also records the highest hourly average in for the week at 47.51 µg/m3 at the after-office rush hour of 8pm.
On weekends, the PM10 concentration typically drops from 12am till 2pm before picking up again toward the end of the day.
Station Type vs Concentration
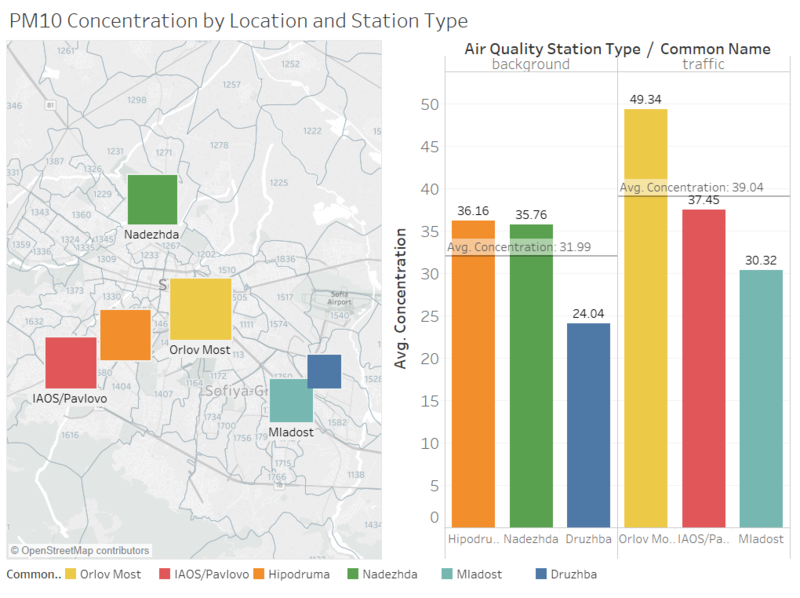
As above, traffic station type has higher than average concentration readings, 39.04 µg/m3, in particular, b>Orlov Most has the highest average reading of 49.34 µg/m3. As compared to background station type, with average of 31.99 µg/m3, traffic station type has higher concentration reading which is not surprising since traffic station type predominantly measures pollution from nearby traffic while background stations reads pollution in general. However, it is interesting to note that Orlov Most, with the highest average PM10 concentration reading, is the station that no longer provides measurement data from October 2015 onwards. Instead, the new Mladost station is reading concentration readings, 30.32 µg/m3, below both traffic and background type average.
Reference
The Tableau Workbook to the above images can be found here
Banner image credit to: MarcusObal

