ISSS608 2017-18 T3 Assign ISSS608 2017-18 T3 Assign DiyaNR data
Jump to navigation
Jump to search
VAST MINI CHALLENGE 2
|
|
|
|
|
|
The Datasets
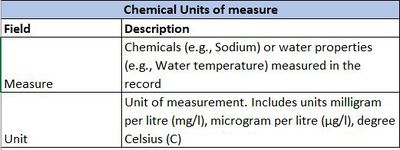
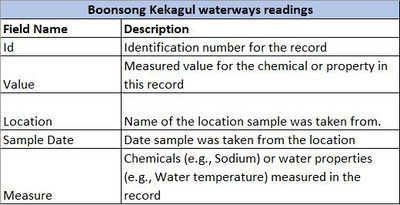
The following are the datasets and their corresponding data fields present
1. Boonsong Kekagul waterways readings
Data Preparation
SAS JMP was used for preparing the data.
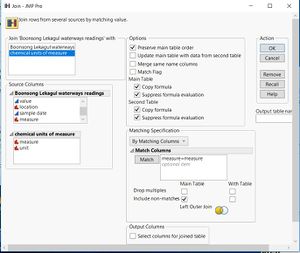
- The two datasets 'Boonsong Kekagul waterways readings' and 'Chemical units of measure' were joined using JMP based on the common 'Measure' Column present in both.
- The units were all converted to a common scale i.e. microgram.
- Sample Date was converted into "Date and Time' type. The dates under the 'Sample Date' Column were recoded from '2098' and '2099' to '1998' and '1999'. This was done using the recode feature in JMP by clicking 'Cols -> Recode'.
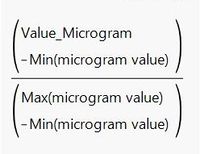
- An additional column called 'Scaled value' was calculated where the values were scaled based on the 'Measure' name, according to the following formula:
where,
Value = Record Value
Min = Minimum value for that chemical.
Max = Maximum Value for that chemical.
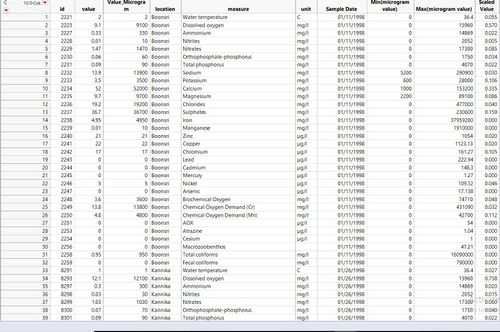
- The final table is as follows:
The Measure or Chemical "Macrozoobenthos" did not have a unit present.
Locating the co-ordinates
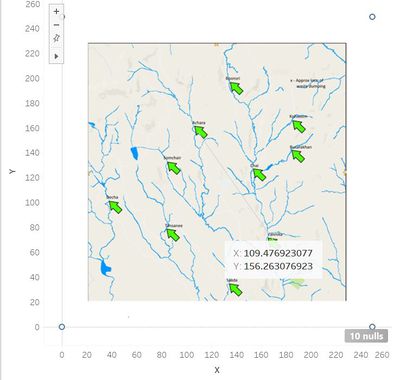
The co-ordinates of the various places were located using Tableau. The waterways image provided was loaded into tableau. The x and y co-ordinates were assigned to each of the 10 places present on the map.
- There are 106 chemicals present in the dataset. These chemicals are measured across the following 10 locations:
