ISSS608 2017-18 T3 Assign DiyaNR visual insights

From Visual Analytics and Applications
Jump to navigation Jump to search

VAST MINI CHALLENGE 2

PREMISE

THE DATA

ANALYSIS

OBSERVATIONS

BACK TO ASSIGNMENT DROPBOX


The analysis was done with the joint dataset consisting of 106 chemicals sampled across 10 locations. The dataset covers 19 years from 1998 to 2016. The analysis was done as follows,

Initial Analysis

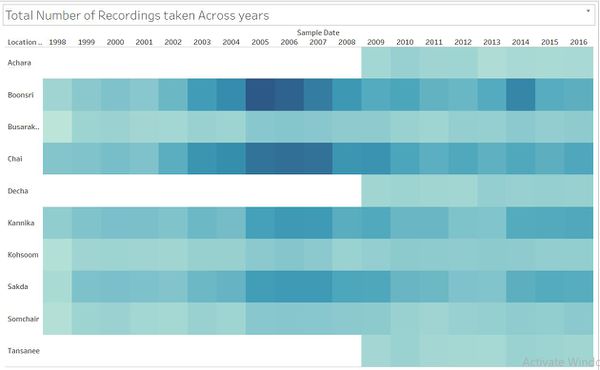
On inspection it can be observed that the chemicals have not been sampled consistently.There are chemicals which have been sampled across all years and those which have been sampled across some years.Due to this the chemicals can be grouped as follows:

  • The following are the chemicals measured across all the years:

Allyears.JPG

  • The following are the chemicals that have been sampled better over the later years (2002 onwards). There is inconsistency in the data.

Recent.JPG

  • The following plot shows the number of recordings, taken across the years in the 10 locations:

Diya numberrecs 1.JPG


The Horizon Plot

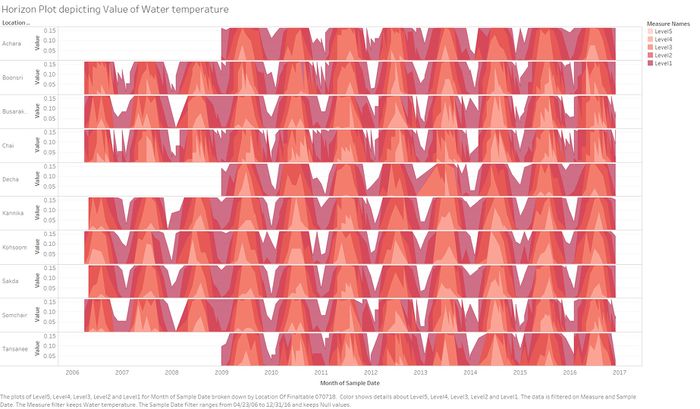
  • The following horizon plot was used to identify chemicals that stood out in terms of intensity.Through the horizon plot across the regions, a seasonal pattern can be observed in the water temperature with higher values during the months of June, July and August, indicative of summer months.

Watertemperature.jpg


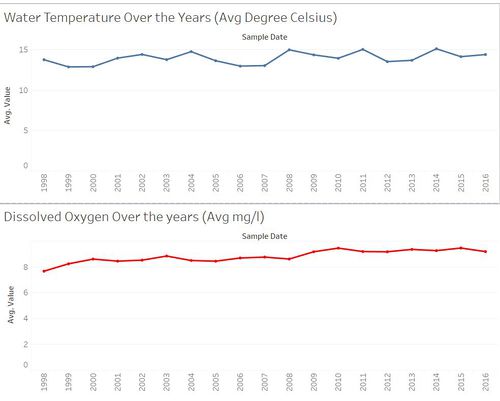
  • There are upward trends seen in the water at Kohsoom, Busarakhan and Chai. On further plotting, it was also found that as the average water temperature increases, there is a decrease in the value of dissolved oxygen.

Diya disoxytemp.JPG


  • The horizon plot can be accessed at the following Link: [1]

Analysis by Chemicals

  • Based on the observations made from the Horizon Plot, the following chemicals were found to have significant trends, as represented in the Control Charts:


Measure

Inference

Anionic active surfactants

Diya anionicsurfactants.jpg

  • There is significant activity seen in Kohsoom in later years.
  • Clear instance of Boonsri and Kohsoom showing an upward trend as compared to rest of the locations, there’s a peak in February 2014 and then July 2015.
  • Data has been measured in all years except 1998.

AOX

Diya AOX.jpg

  • There is significant activity seen in Kohsoom in later years.
  • Post 2010, measurements only in Boonsri and Kohsoom.
  • There is an upward trend in Kohsoom in January 2010 and April 2013.
  • Limited data in 2013 and 2016, hard to compare nearby regions.
  • Pattern observed in Kohsoom, later observed in Boonsri.

Chlorodinine

Diya chlorodine.jpg

  • General Downward trend observed across locations.
  • There is a sudden spike Kohsoom around June 2016.

Fecal coliforms

Diya fcolliform.jpg

  • There are spikes in Kohsoom in primary years
  • There is an upward trend.
  • Peak at Kohsoom in April 2011.
  • Data has only been measured in early years.

Fecal streptococci

Diya fstrep.jpg

  • There are spikes in Kohsoom during the primary years.
  • The spikes are seen around the same time as Fecal Coliforms
  • Upward trend, peak in Kohsoom during April 2011.
  • Data has only been measured in early years.

Mercury

Diya mercury.jpg

  • Activity seen in Kohsoom, however not in later years.
  • Spikes are seen at Kohsoom from March 2010.
  • There is also a peak at Boonsri in July 2011.
  • Data has been recorded in 1998 and then from 2005.

Methylosmoline

Diya methylos.jpg

  • There are peaks at Kohsoom and Tansanee.
  • Somchair and Kohsoom show spikes in Aug 2016.
  • There is an upward trend in both places, with higher rate of change in Somchair.
  • Data has been measured from 2014 to 2016.

Nickel

Diya nickel.jpg

  • There are uptrends seen in Kohsoom in recent years.
  • Post these years, the trend is seen to be continued in Busarakhan and Chai.
  • There are clear spikes in Kohsoom in Feb 2011, May 2012 and September 2014.
  • Data is present in all years except 2010.

Orthophosphate-phosphorus

Diya orthophosphatephosphorous.jpg

  • Significant uptrends seen in Kohsoom and Spikes in Tansanee
  • Kohsoom has an upward trend, with peaks in December 2013 and June 2014.
  • Data has been sampled across all years.

Oxygen saturation

Diya oxygensaturation.jpg

  • Seen but lower in Kohsoom in recent years.
  • There is a dip in value in March 2013 with a downward trend.
  • Data has been recorded from 2005 onwards.

Total coliforms

Diya totalcoliforms.jpg

  • There are spikes in Kohsoom in September 2011, September 2012 and June 2013.
  • Major irregularities in the Data measurement observed (No recordings at Decha post 2011.

Total dissolved phosphorus

Diya disolvedphospo.jpg

  • There are seasonal spikes in Kohsoom, higher than all other locations
  • There is peak in Kohsoom in August 2015.
  • Data has been recorded in the last two years.

Total organic carbon

Diya totalorcarbon.jpg

  • Uptrends seen in Kohsoom in recent years.
  • There are peaks in December 2014, February 2015 and April 2015.

Total phosphorus

Diya totalphospo.jpg

  • There is an upward trend in Kohsoom with a peak in December 2013 which decreases in August 2015.
  • The data has been recorded across all years.