ISSS608 2017-18 T3 Assign Song Xuejing Data Preparation
VAST Challenge 2018: Suspense at the Wildlife Preserve
Mini Challenge 2 - Like a duck to water
|
|
|
|
|
|
|
Data Preparation
We have two dataset which include the chemical units of measure and Boonsong Lekagul waterways readings. There are 106 different chemical measurements of the water, some of them are chemicals that will damage the water, which may possible output by the furniture factory, and some of the chemicals are just minerals such as iron and zinc. Also, these samples were randomly taken from 1998 to 2016. Therefore, firstly, we need to filter out all the chemicals that we need.
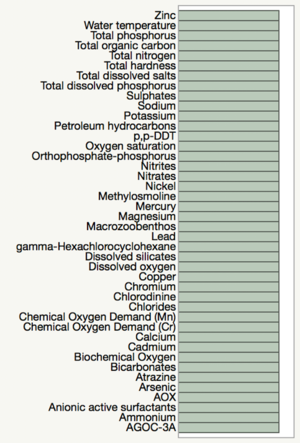
We should use chemicals have enough data points at least in recent years, because we need to identify that the water quality has been bad since the furniture factory has been build. If the chemical is no longer measured anymore, there is no point to identify the changes of the water quality. After first round of filtering, we have these chemicals remaining, only these chemicals have data till 2016.
Overview
After filtering out all the unnecessary chemicals, we can take a look at the overview of all the chemicals in different places one by one. By doing that, we can find some interesting chemicals showing that the value has increased or decreased since 2015 and filter out other chemicals that do not have any trend. Therefore, we can get the answer for question 1.
