ISSS608 2017-18 T3 Assign Song Xuejing Data Preparation
VAST Challenge 2018: Suspense at the Wildlife Preserve
Mini Challenge 2 - Like a duck to water
|
|
|
|
|
|
Contents
Data Preparation
1.1 Choosing Chemicals
We have two datasets which include the chemical units of measure and Boonsong Lekagul waterways readings. There are 106 different chemical measurements of the water, some of them are chemicals that will damage the water, which may possible output by the furniture factory, and some of the chemicals are just minerals such as iron and zinc. Also, these samples were randomly taken from 1998 to 2016. Therefore, firstly, we need to filter out all the chemicals that we need.
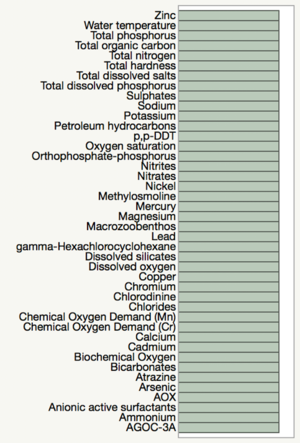
We should use chemicals have enough data points at least in recent years because we need to identify that the water quality has been bad since the furniture factory has been built. If the chemical is no longer measured anymore, there is no point to identify the changes in the water quality. After the first round of filtering, we have these chemicals remaining, only these chemicals have data till 2016.
1.2 Map
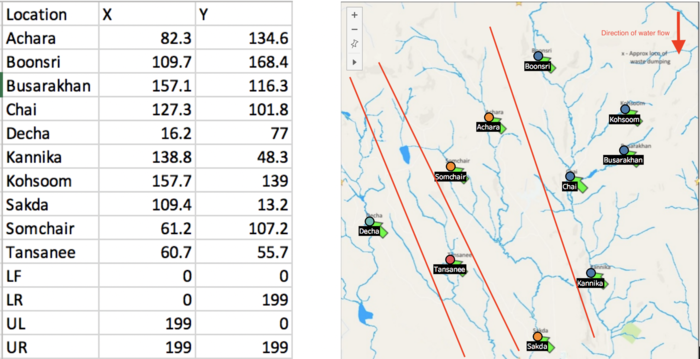
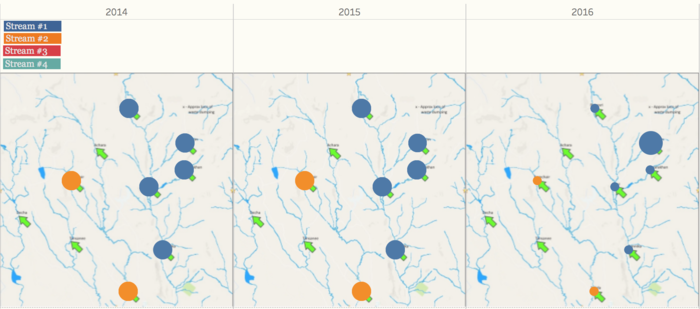
Since we have a map of the locations of sample points and the waterways, we need to map our sample points onto it, in order to detect the anomalies in different waterways. Use this map as the background image in the tableau and create the coordinates of different locations. The locations points and map are shown below. Also, based on the location, we separate all the location into four streams, from right to left on the map, they are 1 to 4, respectively. Because once the upstream of the river has been polluted, the downstream will be affected to some extent. Therefore, we separate the streams as below.
Question 1
After filtering out all the unnecessary chemicals, we can take a look at the overview of all the chemicals in different places one by one. For question1, we need to characterize the past and most recent situation with respect to chemical contamination in the Boonsong Lekagul waterways. Because we don’t know which year the factory was built, we define the recent as data point after 2013, and the past as data points before 2013, in order to see if there is any trend of some chemical measurements. After going through all the chemicals, we have found three apparent type of trends. First, the value of some chemicals increased from past to recent years. Including chemicals as below.
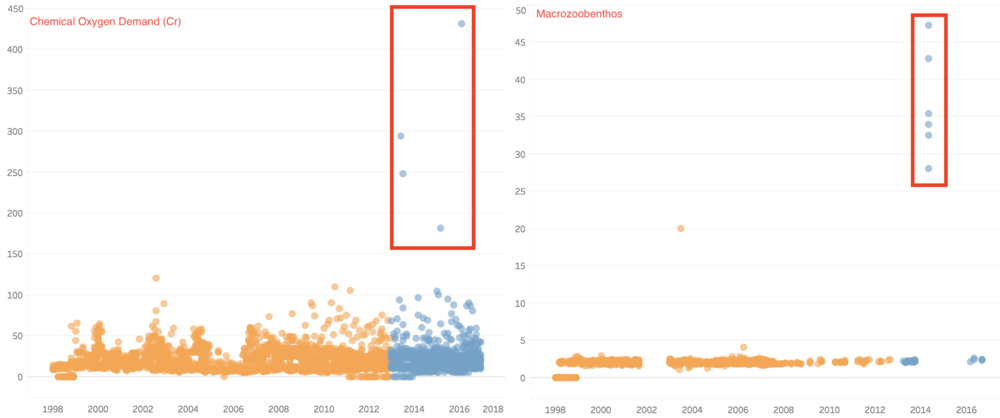
Secondly, the value of some chemicals tends to have more outliers than the past few years, and these chemicals are as shown below.
Thirdly, there is even some value of chemicals decreased from past to recent years, because the samples are not just including chemical contamination, but also include some minerals. Therefore, these chemicals are as below.
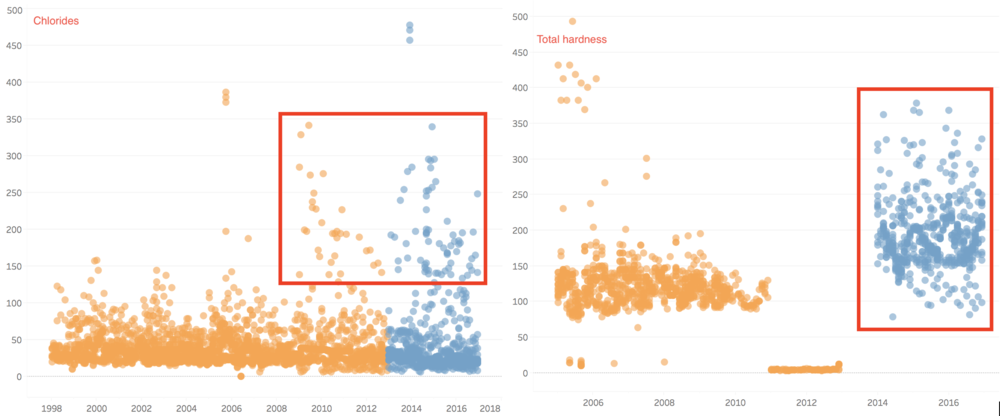
In summary, chemical measurements such as Chlorides and Total hardness have increased from past years to recent years.
For Chlorides, almost all natural waters contain chloride and sulfate ions. Their concentrations vary considerably according to the mineral content of the earth in any given area. In small amounts, they are not significant. In large concentrations they present problems. Usually, chloride concentrations are low.
The EPA Secondary Drinking Water Regulations recommend a maximum concentration of 250 mg/1 for chloride ions and 250 mg/1 for sulfate ions (expressed as Cl- and S04--, not as CaC03).
Therefore, we can notice that the value of chloride has exceeded 20mg/l in recent year, which is not a good thing, and we can dig deeper into the question 2.
For total hardness, it is actually a measurement of groundwater. The value of total hardness has increased, which means the river has a higher content of minerals.
In past years, generally, the value of total hardness varies from 60 - 180 mg/l. However, in recent years, the value increased to 100 - 380 mg/l. According to hardness category, if the value is more than 180mg/l, the category of water is very hard.
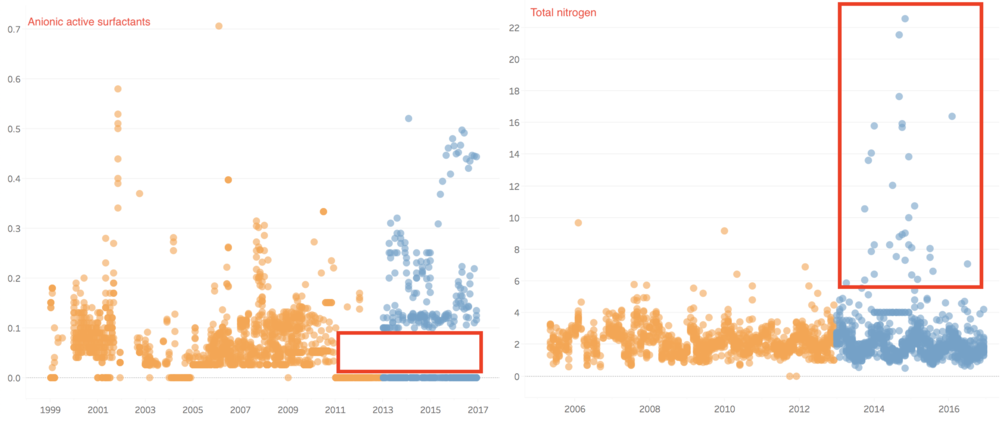
In group 2, there are more outliers in chemical measurements such as Anionic active surfactants, Total nitrogen, Macrozoobenthos, and Chemical Oxygen Demand (Cr).
For Total nitrogen, total Nitrogen is an essential nutrient for plants and animals. However, an excess amount of nitrogen in a waterway may lead to low levels of dissolved oxygen and negatively alter various plant life and organisms. In our cases, the value of total nitrogen has more outliers since 2013.
There are three forms of nitrogen that are commonly measured in water bodies: ammonia, nitrates, and nitrites. In further analysis, we can drill down to see which chemical contribute more to this measurement.
Macrozoobenthos is practically defined as the invertebrate community living in or on the sediment or hard substrates and retained on a 1 mm2 mesh sieve.
And the value of Macrozoobenthos actually in groundwater is very low during these years, however, the outliers in 2014 are very different from other years.
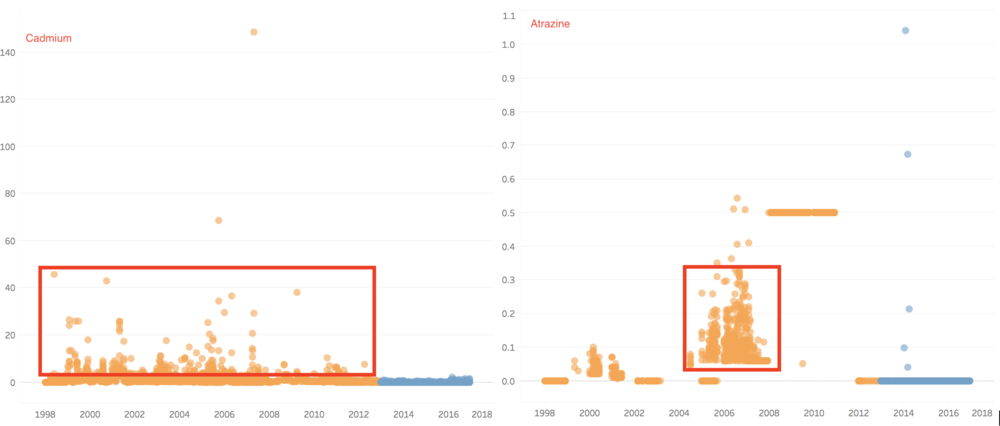
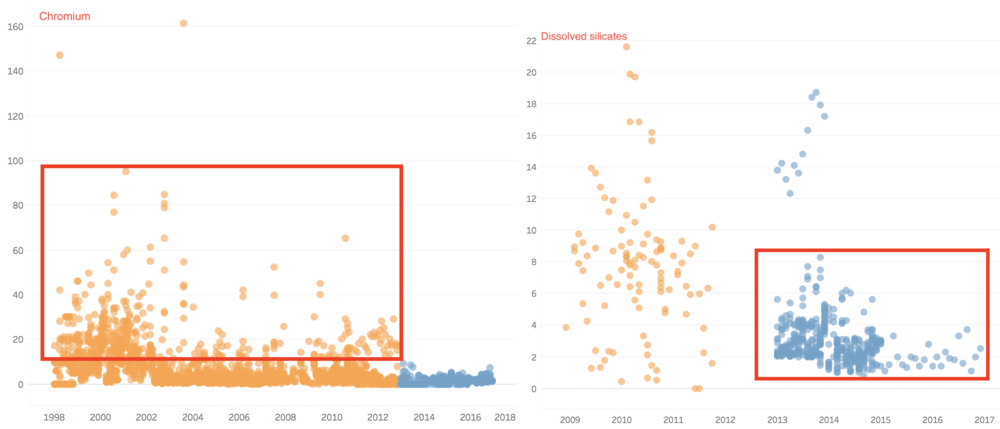
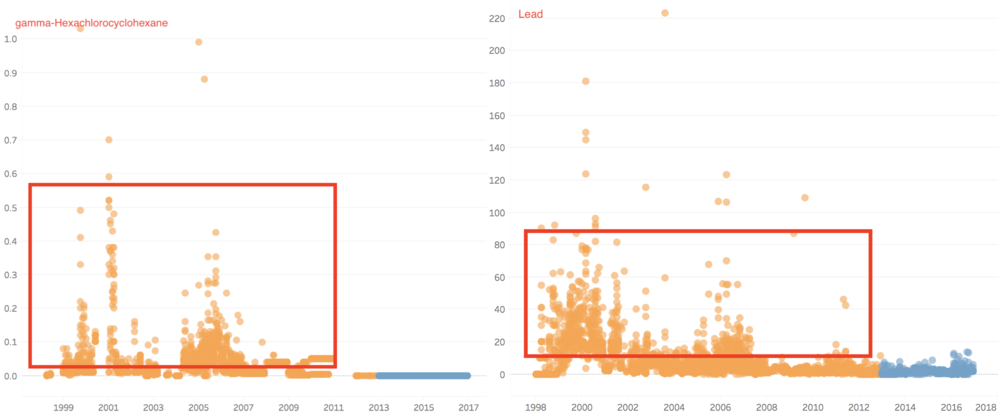
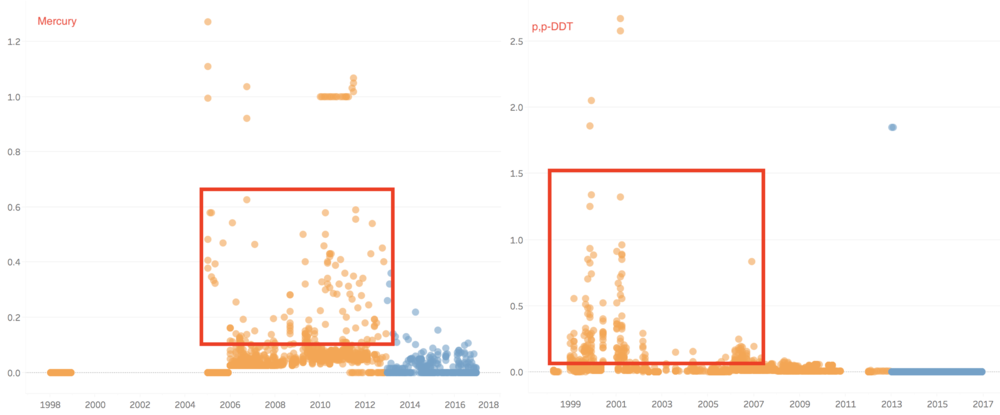
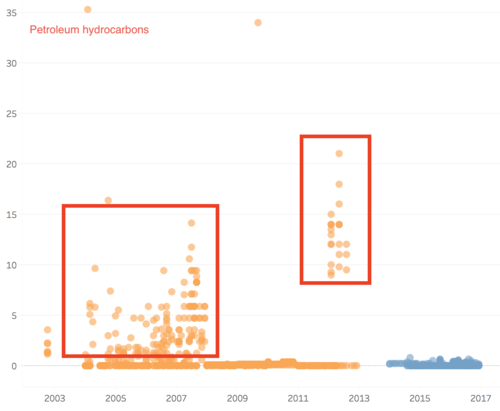
In group 3, the value of chemical measurements such as Atrazine, Cadmium, Chromium, Dissolved silicates, gamma-Hexachlorocyclohexane, Lead, Mercury, p,p-DDT, and Petroleum hydrocarbons have decreased from past years to recent years.
Atrazine is well tolerated by actively growing corn and sorghum, which absorb and metabolize the herbicide and thereby detoxify it. In recent years, the value of Atrazine nearly all become 0 µg/l. the outlier value of gamma-Hexachlorocyclohexane, Cadmium, and Chromium decreased a lot, and in recent years, the value of these two chemicals is very stable. Lindane(gamma-Hexachlorocyclohexane) has been detected in groundwater and surface water samples collected near hazardous waste sites, however, in our cases, the value is zero in recently. Therefore, to some extents, the river may also have become better.
Question 2
What anomalies do you find in the waterway samples dataset?
Anomalies 1: Anomalies of Chemical measurements
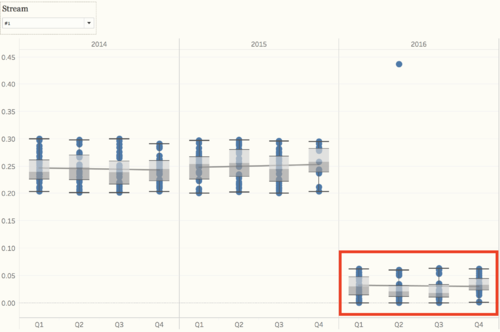
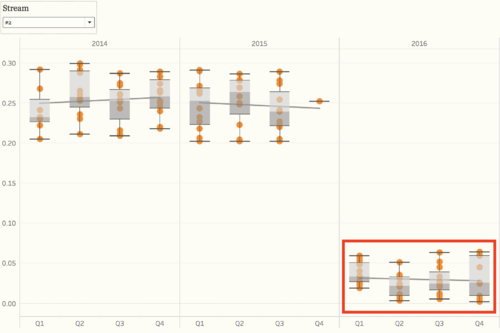
From the overview of all the chemical measurements, we may want to look into the details of different locations, and we can find out which location contribute to the value most and result in the contamination of the river. Because we need to find out the anomalies in the waterway and want to find out the effects of factory dumpping sites, we only use data in recent years, to detect the anomalies of chemical measurements. For chemical measurement Chlorodinine, which only have sample data points from 2014 - 2016. The distribution of it is distinguished from other chemicals. Both in stream #1 and stream #2, the value in 2016 decreased to below 0.1 µg/l. From the map, we can notice that the chemical value of Chai, Boonsri, and Busarakhan in stream #1 was decreasing from 2014 to 2016. However, the chemical value of Kohsoom kept increasing from 2014 - 2016. In stream #2, the chemical value of both of the locations, Somchair and Sakda, was decreasing from 2014 - 2016.
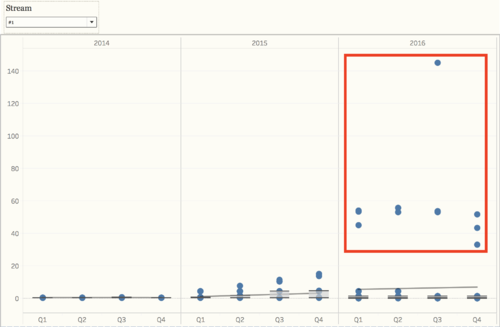
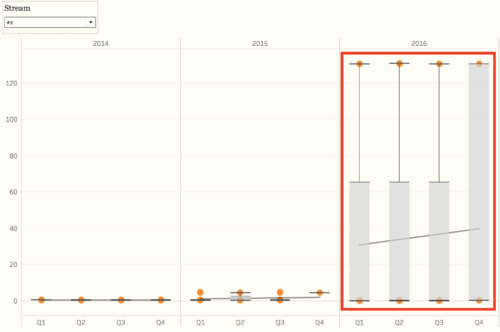
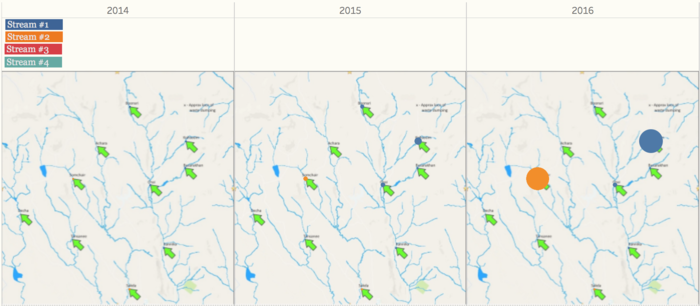
Also, there is another chemical called Methylosmoline, which only have the sample from 2014 - 2016. The value of it in stream #1 has an upper trend since the beginning of 2015, and the value stayed at around 50 µg/l in 2016. In stream #2, the situation is more extreme. In 2014 and 2015, the value is relatively stable around 0 µg/l, however, some of the sample points increased to 130 µg/l in 2016. Moreover, from the map, we can find out that Kohsoom from stream #1 and Somchair from stream #2 are the locations that have to contribute to the high level of values.
Anomalies 2: The sampling Methods
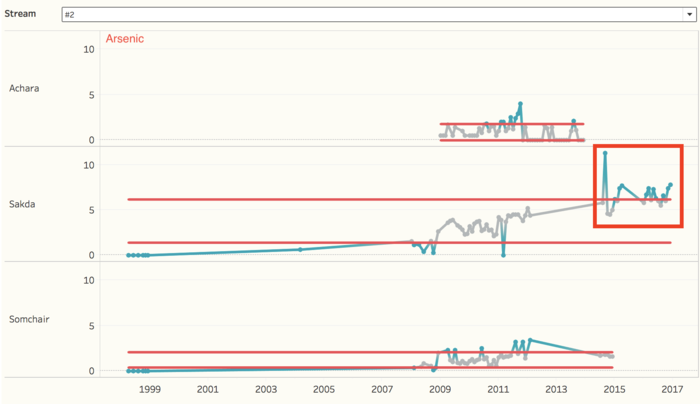
From some of the control charts, we found that the sampling time is not consistency. Some chemical measurements have shown an interesting trend in one location, however, other locations don't have the sample during that period.
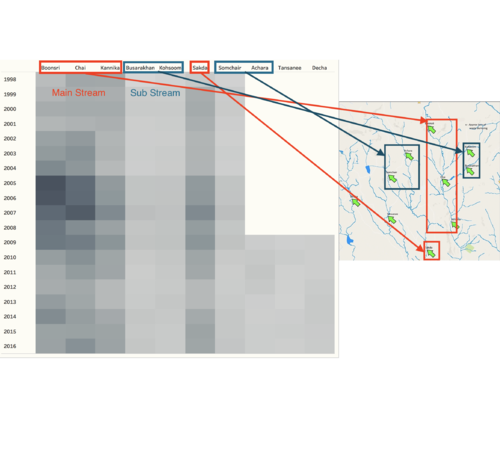
The map showed that there are four streams in this river, but the point source of sampling is different for each stream. For example, stream #1 has 5 sample locations, however, stream #3 and #4 only have one sample location.
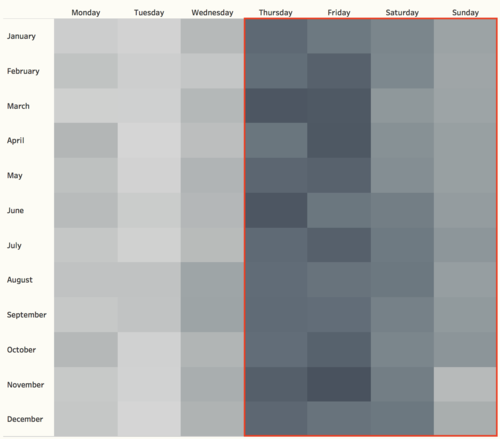
Also, the frequency of each location is not the same. Also, the date of sampling is not on a regular basis. Samples are less on Monday to Wednesday. Most importantly, the some of the locations only have samples from 2009, and the samples are more on mainstream, less on substream.
How do these affect your analysis of potential problems to the environment?
- The anomalies will affect the upper bound and lower bound of the control charts, which will increase the difficulty of detecting anomalies. Therefore, it will be harder for us to detect the potential problems to the environment.
- The sample time should be consistent for each location and each chemical measurement. If we do not have the same sample date for each location, we cannot control the different variables, to decide whether it is a potential problem or not.
- The sample date should be evenly spread over the whole month. For the reason that this is a forest Preserve, it will attract many people to come on public holidays or weekends. This will also affect the sample result of different chemicals.
Is the Hydrology Department collecting sufficient data to understand the comprehensive situation across the Preserve?
No, these data are not sufficient at all. As mention before, the sampling method is quite misleading to analyze the potential problems to the environment.
What changes would you propose to make in the sampling approach to best understand the situation?
A dynamic system is one whose content changes with time. Most locations which we wish to characterize bt taking samples are dynamic to some extent and show both spatial and temporal variation. When a river or a waste effluent stream is to be characterized, its concentration will probably change over a period of minutes, days, or hours.
Therefore, in order to detect potential problems to the environment, the department should use systematic sampling method combined with other methods. Systematic sampling, where points are selected at regular and even intervals, is statistically unbiased - providing the coordinates of the first sampling point are determined by random numbers.
Systematic sampling does not generate a cluster of sampling points and is easier to use to survey sampling locations than random sampling.
Also, an ideal approach for some environmental measurements is the installation of instrumentation to monitor levels of pollutants continuously. These real-time measurements provide the most detailed information about temporal variability.
Question 3
After reviewing the data, do any of your findings cause particular concern for the Pipit or other wildlife?
As mentioned in the question 2, from the box plot, we can see that the value of Methylosmoline and Chlorodinine is abnormal in recent years.
From the website of VAST Challenge, we can know that the soil samples taken from the site were inconclusive in detecting Methylosmolene (the toxic manufacturing chemical in the suspected dumping) or any other contaminant, as new topsoil had been trucked in.
And the value has increased since 2015 in both stream #1 and #2, that's why it will affect the wildlife.
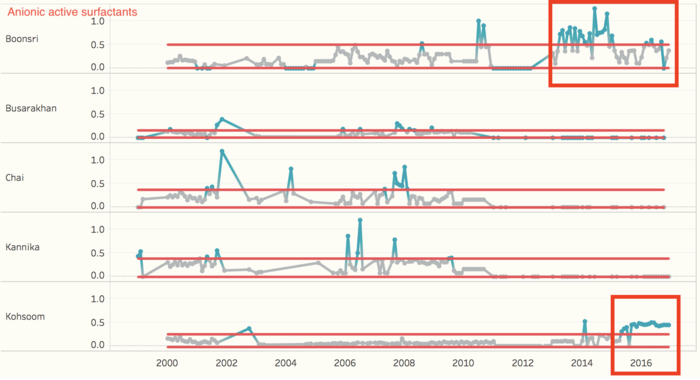
As mentioned in the question 1, the Anionic active surfactants have a trend in recent years. By looking at the control chart, we can detect that the values in Kohsoom and Boonsri in recent years were exceeded the upper bound. For Anionic active surfactants, surfactants are compounds that lower the surface tension (or interfacial tension) between two liquids, between a gas and a liquid, or between a liquid and a solid. Surfactants may act as detergents, wetting agents, emulsifiers, foaming agents, and dispersants. The value of recent years is diversity. Most of the values are zero, and some of the value is higher than 0.1. Unlike past years, there is a gap between 0 to 0.1 mg/l. Anionic surfactants represent, by volume, the most important group of surfactants used in cleaning products. Therefore, if the value of Anionic active surfactants is mostly 0 mg/l, which means the water quality may not as good as before because the cleaning ability of the water has become lower.
Would you suggest any changes in the sampling strategy to better understand the waterways situation in the Preserve?
If the department is going to collect more comprehensive samples, they should do sampling using sampling vessels.
Rinse the sampling vessel with water on site 3 ~ 4 times. Care must be taken to avoid contaminating water to be sampled during rinsing.
