ISSS608 2017 T3 Assign BI HE DataPrep
|
|
|
|
|
|
Data Preparation
The original dataset contains 136,824 rows, but for the same time at the same location, it has more than one record, and it may disturb further analysis. If there is more than one record, only the average number will be left to represent the specific record.
The function “Summary” from JMP can be used to generate the new table.
The new dataset contains 67,503 rows
Measure Method
The waterway data is usually driven by the seasonal change of the river--the pulse of the water. Month-to-month comparison is suitable for the situation, for this method can eliminate the effect of season.
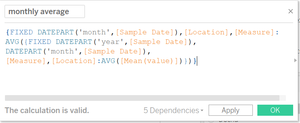
Monthly average
To observe the change across years, the measure of monthly average can be used as criterion. Create calculation field and compute the monthly average by the formula below. The measure can be used to discover the abnormal phenomena in time series for specific location.
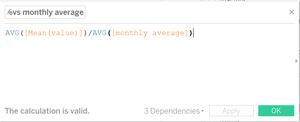
%vs monthly average
Diff from monthly avg.
Diff from monthly avg.=%vs monthly average – 1
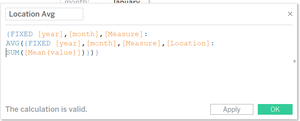
Location avg.
The measure is for comparing data in different locations at the same time, it can be used to find out the abnormal location in the specific time period.
%vs location avg.
{FIXED [year],[month],[Measure]:AVG({FIXED [year],[month],[Measure],[Location]:
SUM([Mean(value)])})}
Diff from location avg. %vs location avg-1


