Difference between revisions of "Project Groups"
Wklim.2017 (talk | contribs) |
Yi.fu.2017 (talk | contribs) |
||
| Line 208: | Line 208: | ||
|| | || | ||
<div style="text-align:center;"> | <div style="text-align:center;"> | ||
| − | [[ | + | [[Image:Property.jpg|350px|frameless|center|link=https://wiki.smu.edu.sg/1718t3isss608/Group07_Proposal]] |
[[Group07_Overview|Group07]] | [[Group07_Overview|Group07]] | ||
</div> | </div> | ||
|| | || | ||
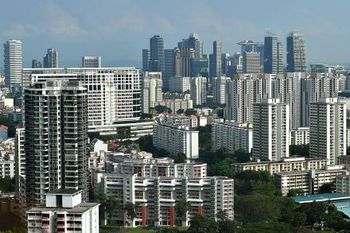
| − | ''' | + | '''Singapore Property Market Watch - Your new tool to visualize SG Property Trend'''<br> |
| − | + | "Have your heard that Singapore IRAS increased Stamp Duty rate?! US Federal Reserve will increase the interest-rate again?! How does Singapore Property market going to change now, we wanna see market trend leh, but how?" | |
| + | |||
| + | There is a deficiency of Market Watch tool for analysing the real estate market data as well as the trends properly. As it is very important to show the trendline cross different years and time, however, these data are still in table formats and the visualizations are quite basic, most of trends are illustrated statically, static graphs are not explanatory enough to show a full picture of changes, which sets barriers for readers from getting any useful insights and findings. | ||
| + | |||
| + | To better understand how the Real Estate market price moves cross different type of sales, property types and planning areas in the last 20+ years. Our team will provide an unbiased visualization tool for readers to understand and compare the Property Market pattern changing overtime. | ||
| − | |||
|| | || | ||
Revision as of 21:48, 21 July 2018
 ISSS608 Visual Analytics and Applications
|
|
|
|
|
|
Project Groups
Please change Your Team name to your project topic and change student name to your own name
| Project Team | Project Title/Description | Project Artifacts | Project Member |
|---|---|---|---|
|
Project title: Provide eyes catching title. However, it should reflect the content or/and the focus of your project Abstract The abstract should not be more than 350 words. |
| ||
|
Cyber-security: you are in more danger than you can possibly imagine Cyber-attacks are becoming increasingly sophisticated. Coupled with the growing amount of data being generated by individuals, corporations and governments, well-orchestrated attacks could potentially cause major disruptions to any country, such as gaining access to national defense systems. According to David Koh, CEO of Singapore’s Cyber Security Agency, Singaporeans are largely aware of cybersecurity threats but do not take the necessary precautions, which may be due to complacency stemming from Singapore's reputation as a safe country1. Hence, public education is still required to urge individuals into taking preventive measures. This project will contribute to that end by providing interactive and interesting visulisations of cyber-attacks that can engage members of the public. 1https://govinsider.asia/innovation/cyber-war-csa-singapore-david-koh/
|
| ||
|
|
Analyzing World Energy Production & Consumption For 66 years, the BP Statistical Review of World Energy has provided high-quality objective and globally consistent data on world energy markets. The review is one of the most widely respected and authoritative publications in the field of energy economics, used for reference by the media, academia, world governments and energy companies. A new edition is published every June. Join us as we explore the rich data-set provided by BP & explore trends in energy production and consumption across countries through time. |
| |
|
|
Perceiving Evil: The Study of the Corruption Perception Index
Is it true that a corrupted country is naturally poor? Are GDP growth linked with corruption? Does corruption affect foreign investment? Does the gender composition of the country affects corruption? Are the rural / urban divide in a country contributing to its corruption level? We will try to find out here. |
| |
|
Water For Life: An Analysis of Changing Rainfall Patterns Across India Through Visualizations
In this study, we intend to analyse India’s rainfall patterns for past few years using Exploratory techniques. Over 80% of the annual rainfall is received in the four rainy months of June to September. There is great regional and temporal variation in the distribution of rainfall and although the monsoons affect most parts of India, the amount of rainfall varies from heavy to scanty on different parts. The primary motive of our analysis is to scrutinize the effect of irregularities in the rainfall pattern on crop yield in agriculture sector in India and in turn attempt to discover any relation between the growing rate of suicides amongst farmers. Through our visualizations, we would like to derive meaningful insights that foster our understanding about how climactic changes have an influence on various factors including socioeconomic factors that might lead to these suicidal attempts.
|
| ||
|
|
Exploring Inequality’s Geographic Dimension Across Neighbourhoods in Singapore: Its Driving Forces & Touch Points Amidst the recent debate over growing social inequality in Singapore such as the distinct clustering of elite schools and varying access to resources, the dangers of hardening social mobility can pose as a threat for a culturally diverse nation that has upheld its values of social cohesion and racial harmony. In bonding and bridging communities, Singapore has put in place various programmes in the community and schools to nurture shared experiences and promote inter-communities mixing. More recently, inequality was highlighted to have a geographic dimension even for a densely populated city like Singapore. Using geospatial techniques in R, the dashboard serves to visualise whether geography is an important driver of inequality, by mapping the extent of social inequality and access to common spaces across neighbourhoods. This will be done via three approaches. First, we will analyse whether there exist clusters that could point towards social inequality and whether this is more pronounced in certain neighbourhoods, based on ethnic mix, age composition, and housing type. This will be done using choropleth mapping, spatial segregation index, and spatial points pattern analysis at both the subzone and dwelling unit level. Next, using the Hansen Accessibility Model, we will map out the available touch points within neighbourhoods that could facilitate social mixing, such as the ease of access to common spaces, amenities and opportunities for choice of education. This is because an important aspect of social inequality is having reasonably fair access to different resources. Lastly, by identifying centroids, we will move into solutioning and explore possible spaces such as vacant state land where upcoming public amenities can be best placed to optimise social class mixing. |
| |
|
Buy More! – Maximizing Revenues Taking advantage of data is key to ensuring the survival of an e-commerce retail business. Through the visualization of the spending habits of customers and the visualization of the results from various machine learning algorithms, insights can be gathered as to which customers the retailer should target and what type of products should be kept in-stock to maximize sales. |
| ||
|
Singapore Property Market Watch - Your new tool to visualize SG Property Trend "Have your heard that Singapore IRAS increased Stamp Duty rate?! US Federal Reserve will increase the interest-rate again?! How does Singapore Property market going to change now, we wanna see market trend leh, but how?" There is a deficiency of Market Watch tool for analysing the real estate market data as well as the trends properly. As it is very important to show the trendline cross different years and time, however, these data are still in table formats and the visualizations are quite basic, most of trends are illustrated statically, static graphs are not explanatory enough to show a full picture of changes, which sets barriers for readers from getting any useful insights and findings. To better understand how the Real Estate market price moves cross different type of sales, property types and planning areas in the last 20+ years. Our team will provide an unbiased visualization tool for readers to understand and compare the Property Market pattern changing overtime.
|
| ||
|
|
Group 8: Given the growing importance on this area, our project seeks to encapsulate existing data and present it visually in a simple, understandable manner, to help further efforts in driving the agenda. Using graphical techniques complemented with some level of statistical modelling in R, our dashboard will provide a view on changing patterns in key indicators relating to gender equality and women empowerment with time, as well as attempt to highlight important variables which aid the growth of such indicators. |
| |
|
Human Disease Symptom Network |
| ||
|
|
Global Migration - Higher Walls or Wider Doors? With the world shrinking by the day with technology and humans being more than ever ready to scale distances in quests to follow a career path or to escape political persecution and war or in search of better quality of life or to be closer to family or friends, Migration and the resulting ethnic and racial diversity are amongst the most emotive subjects in contemporary societies. In recent times, the political salience of migration has strongly increased due to uproar of natives and other factors. For origin societies, the departure of people raises concern about the 'brain drain' on the one hand. For receiving societies, the settlement of migrant groups and the formation of ethnic minorities can fundamentally change the social, cultural, economic dimensions and cause lack of resources for the natives. Using R’s geospatial and network analysis techniques, we aim to delve into the migrant numbers data over the years from country to country conjoined with the remittances according to the world bank by them to the origin locations. Migration and remittance numbers will be analysed grouping the locations on continent, region and socio-economic status scales to identify relations between the factors separating the dominating and the dominated societies. This will be done using visual models employing quadrant analysis to visualize how the numbers have changed over the years due to varying push and pull factors according to the current world situations, flow mapping and creating a betweenness clustering and centrality index network model to solution the question on the profitability of migration from the eyes of the origin and destination societies. |
| |
 |
Predictive Policing: The future can be seen Crime is an act punishable by law that has been timeless and has been committed practically since the start of time. Crime analysis is required to reveal the complexities of crime records. The ability to predict the future crimes based on the location, pattern and time can serve as a valuable source of knowledge for them either from strategic or tactical perspectives. This process will help the law enforcement in identifying potential hotspots and implementing crime prevention strategies To predict future crime accurately with a better performance, it is a challenging task because of the increasing numbers of crime in present days, and erratic activity patterns. Therefore, crime prediction method is important to identify the future crime and reduces the numbers of crime. For our analysis, we will be using the New York Police Department (NYPD) crime data for the City of New York. Through our analysis, we hope to provide a comprehensive overview of crime statistics in these 5 boroughs of New York City and illustrate the power of using this data for predictive policing for law enforcement agencies across the world.
|
| |
|
Group 12
Through our visualizations, we seek to utilize existing data to derive meaningful insights over how various socioeconomic factors have had an impact on development of different nations. Using graphical techniques in R, our dashboard will feature analysis on key indicators relating to financial, educational, gender, health, industry & demographic as well as attempt to highlight important variables which aid their growth. |
| ||
|
|
Earth is What We All Have in Common The Organization for Economic Co-operation and Development is an intergovernmental economic organization with 37 member countries, founded in 1961 to stimulate economic progress and world trade. Most OECD members are high-income economies with a very high Human Development Index (HDI) and are regarded as developed countries. As of 2017, the OECD member states collectively comprised 62.2% of global nominal GDP (US$49.6 trillion) and 42.8% of global GDP ($54.2 trillion) at purchasing power parity. But has this economic progress come at a cost? During this period, the reported green house gas (GHG) emissions has shown a rising trend. For instance, there was a large decrease in GHG emissions in 2009 due to economic recession, further enforcing our fears that human activities could have drastic impact on climate change. However, can the overall trend in GHG emissions be certainly attributed to changes in economic activity? Is there a clear convergence between economic activity and GHG emissions, resulting in a strong downward or upward trend in the GHG emissions intensity of economic activity, measured as GHG emissions per unit of GDP. Join us on our data visualization expedition as we attempt to uncover some startling facts on climate change and driving forces |
| |
|
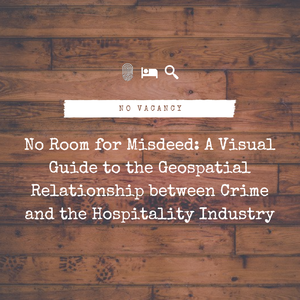
No Room for Misdeed: A Visual Guide to the Geospatial Relationship between Crime and the Hospitality Industry In 2016, there were 1.459 billion departures made by international outbound tourists from their country of usual residences, which was an increase of 46% from the 999 million departures in 2006, in a span of 10 years.[1] Additionally, the tourism industry has contributed significantly to the world’s economy, where the recorded expenditure of international outbound tourists in other countries amounted to USD 1.362 trillion[2].
However, there are various social and environmental implications that comes with the growing global hospitality business. Prior researches have shown that there is a relationship between crime and public disorder, and tourism[3], and tourists are often the victims of these crimes.[4] Therefore, this project aims to create a visualisation of the spatial relationship between crime and hospitality, and to delve deeper into understanding the difference in the relationship between crime and the conventional hospitality business – Hotels and Hostels, and between crime and Airbnb. Additionally, this project will drill down into visualizing the different types of crimes that are most spatially related to the different categories of hospitality business. |
| ||
|
Bird, Where Art Thou? Animal migration has long received much attention as a research topic in biology. Information about animal movement serves to allow us to understand animal behavior and their interactions with each other and the environment. In addition, it allows us to address environmental challenges such as climate and land use change. Understanding animal migration helps conservationists to conserve these animals through the protection of their habitats and their resources. An interactive visual analytics approach would provide valuable insights to the scientific community on the migration of these animals.
|
| ||
|
|
Urban Pulse —— A case study to uncover Beijing's traffic patterns
|
| |
|
GeBiz: Who supplies to the needs of Singapore? Government Procurement is the procurement of goods and services on behalf of a public authority. As per policy, the procurements need to be done through an issue of public Tenders to prevent corruption, wastage, and local protectionism. GeBiz is the Singapore government's one stop portal for the above purpose. The data of past procurements are made available for the public in the Data.gov.sg portal. It is difficult to identify bias in such data available that have multiple transactions. Since a transaction involves various levels of the government, the bias may not be obvious while looking at the issuing authority and the supplier alone. We propose an approach which combines network analysis, association analysis, and visual analytics to make this process easier. Traditionally, Association analysis has been used to identify relations between products purchased together. It is also applicable to any data that follows the format of multiple entities and a common transaction that links them together. In our case, the entities involved are the issuing agency and the supplier. The current visualizations treat all entities involved to be of the same category, thus making the visualization less intuitive. We want to come up with a visualization that can overcome this limitation. |
| ||
|
|
Crime and Society : The new age of offence in India With increase in urbanization and globalization, crime rate across societies in the world is increasing day by day. Technology advancement is also cited as a reason for increasing crime rates. The rise in crime is viewed as a matter of major concern to any society. India is an emerging country with high crime rates. We want to leverage on visual analytics capabilities to understand distribution and patterns of different crimes across India at district level. We also intend to supplement National Crime data with other external information such as census information to better understand crimes within India. |
| |
|
|
Male or Female, that is a question!! Based on “The Global Gender Gap Report 2017”, China remains the world’s lowest ranked country with regard to the gender gap in its sex ratio at birth. Tracing back to previous census data and demographic statistics, sex ratio at birth in China has been on the high side since the early 1980s and rising continuously. In this project, We try to find out the socio-economic and cultural factors that leading to the increase of the sex ration at birth, which may be meaningful to curb the increase of birth sex ratio and restore it to normal level. |
| |
|
The air quality in China To understand the improvement of air quality of developed cities and the impact of air quality on the health of residents, we choose four first-tier cities (Beijing, Shanghai, Shenzhen and Guangzhou) and 15 new first-tier cities (Chengdu, Hangzhou, Wuhan, Nanjing, Chongqing, Tianjin, Suzhou, Xian, Changsha, Shenyang, Qingdao, Zhengzhou, Dalian, Dongguan and Ningbo) to analyze. |
| ||
|
Making "Realty" a Reality! With inflation in prices of land and an increase in human population, the Real Estate Market in Singapore has seen high volatility over the years. We observe that the market has significantly higher demand than supply, thereby creating a dilemma for people about the kind of property they should invest in. Our project is based on real estate sales data from 2013-2015 and provides transaction details, data on building amenities and distance to key locations for Apartment, Condominium and Executive Condominium units. Through the scope of this project, we intend to provide a detailed understanding of the real estate market so that the users of the application can make a more informed decision. We believe that real estate agents and brokers, economists, investors and other enthusiasts can use the application to understand market trends and make investment decisions. |
| ||
|
Small loan, Big difference Kiva is an international non-profit, founded in 2005 and based in San Francisco, with a mission to connect people through lending to alleviate poverty. Kiva celebrates and supports people looking to create a better future for themselves, their families and their communities. What we try to do is helping the website extend to more countries and helping more people solve the survival problems. |
| ||
|
|
MAKE THE WORLD A BETTER PLACE TO “BREATHE”
Our project aims to create a collaborative interface to track for everything that is happening in the world and to which extent air quality can be affected by these factors. These factors may cover most of economic, social, political, cultural areas, so that we will be able to look at air pollution issues from a bigger picture instead of air itself.
|
| |
|
|
CricViz: Indian Premier League Cricket, the second most popular sport in the world, is a bat and ball game played between two teams, 11 players each, on a field which has a rectangular 22-yard-long pitch in the center. The game is played by 120 million players worldwide and the purpose of the game is to score more runs than your opposing team. The Indian Premier League (IPL), is a professional Twenty20 Cricket League in India contested during April and May of every year by teams representing Indian cities and some states. The league was founded by the Board of Control for Cricket in India (BCCI) in 2008. This project is about exploring the statistics of historical IPL data of 8 seasons (2008-16) to understand patterns in individual player performance, team strengths & weaknesses, time series analysis to find the Most Valuable Players (MVPs), and thus suggest the best IPL team for each season, amongst others.
|
| |
|
Singapore Bus Services - Perfection is not a destination; it is a continuous journey that never ends
Our objective is to suggest ways to increase the efficiency and optimization of the current Singapore bus route by visualizing some of the problems the current Singapore bus services have. Our main target is buses that have unusually long travelling time. If we successfully suggest ways to split the buses, not only we will be able to reduce travelling time (thus reducing cost related problem), but we will also able to reduce overcrowding problem and in turn increase passenger satisfaction.
|
| ||
|
Trade War -- the Story Behind the Lose-Lose Game
In terms of the trade war itself, the world’s two largest economies threating to impose tariffs will have a very direct and negative impact on global economy. What is the story behind the trade war which is deemed to be a lose-lose game? How to analyze the underlying strategic intent? Let's use visual analysis tools to figure out together.
|
| ||
|
Airbnb's impact on affordable housing in New York Community groups and housing advocates in cities across the world have begun to sound the alarm about the impact Airbnb is having on affordable housing in their communities, citing concerns about housing supply lost. We chose New York, a typical Airbnb city, as an entry point to understand Airbnb’s impact on housing. We aim at presents a comprehensive visual analysis of 3 years from 2015 to 2017 of Airbnb activity in New York City. It relies on the most comprehensive third-party dataset of Airbnb activity available, and methodologies of visualize and analysis geographical data.
|
|