Difference between revisions of "ISSS608 2017-18 T3 Assign Akanksha Shrirang Yadav eda"
| Line 32: | Line 32: | ||
To answer question 1 of the challenge, following visualizations were built. | To answer question 1 of the challenge, following visualizations were built. | ||
| + | <br/><br/> | ||
| − | + | <div style=background:#2B3856 border:#A3BFB1> | |
| + | <font size = 3; color="#FFFFFF">A View of The Overall Trend Across Years</font> | ||
| + | </div> | ||
| − | + | <big><b><i>Number of Sound Recordings Plotted Against Years – Bird Species Wise</i></b></big> | |
| + | <div> | ||
| + | <br/> | ||
| + | [[File:T3_Assign_EDA2.png|700px|left]] | ||
| − | + | To begin with, the count of recordings (as per species) over the duration of data collection was plotted against the duration of collection to understand the trend through years. It could be noticed that for initial years there aren’t enough data points for almost all the species. Hence, for further analysis for plotting trends, data from year 2002 onwards was considered. | |
| + | <br/><br/><br/><br/><br/><br/><br/><br/><br/><br/> | ||
| + | </div> | ||
| − | << | + | <br/> |
| + | <big><b><i>How the Birds are Dispersed Across the Preserve & the Location of the Alleged Dumping Site</i></b></big> | ||
| + | <br/> | ||
| + | [[File:T3_Assign_EDA1.png|700px]] | ||
| + | <br/><br/> | ||
| + | |||
| + | <div style=background:#2B3856 border:#A3BFB1> | ||
| + | <font size = 3; color="#FFFFFF">Looking At the Distribution & Movement of All Birds Species Across the Preserve</font> | ||
| + | </div> | ||
Below figure shows the distribution of bird sound recordings across the preserve for each species: | Below figure shows the distribution of bird sound recordings across the preserve for each species: | ||
| − | << | + | <br/> |
| + | [[File:T3_Assign_all_recordings_plot.png|500px|center]] | ||
| + | <br/> | ||
| − | As can be observed, few of the bird species have never been spotted | + | As can be observed, few of the bird species have never been spotted or recorded near the alleged dumping location such as “Qax”, “Pinkfinch”, and “Bent-beak Riffraff”. Although, bulk of the “Rose-crested Blue Pipit” clusters have been spotted at the dumping location or in region nearby the dumping location, this does not give a conclusive indication about the situation of the Pipit. Since, from the overall time trend it can noticed that the species which have not been spotted near the dumping location show an overall decreasing trend since 2013. |
Interestingly, bird species “Carries Champagne Pipit” & “Green tipped Scarlet Pipit” show an increasing trend since 2015 despite being spotted near the dumping location. | Interestingly, bird species “Carries Champagne Pipit” & “Green tipped Scarlet Pipit” show an increasing trend since 2015 despite being spotted near the dumping location. | ||
| + | <br/> | ||
| + | <div style=background:#2B3856 border:#A3BFB1> | ||
| + | <font size = 3; color="#FFFFFF">A Closer Look At Rose-crested Blue Pipit</font> | ||
| + | </div> | ||
Now, let’s take a closer look at the species that we are interested in – “Red-crested Blue Pipit” | Now, let’s take a closer look at the species that we are interested in – “Red-crested Blue Pipit” | ||
Revision as of 05:57, 8 July 2018
|
|
|
|
|
|
|
To answer question 1 of the challenge, following visualizations were built.
A View of The Overall Trend Across Years
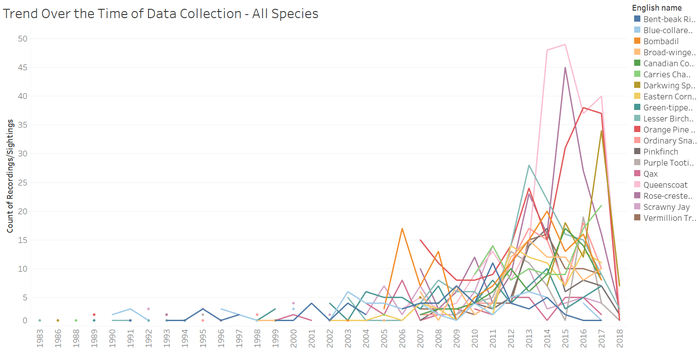
Number of Sound Recordings Plotted Against Years – Bird Species Wise
To begin with, the count of recordings (as per species) over the duration of data collection was plotted against the duration of collection to understand the trend through years. It could be noticed that for initial years there aren’t enough data points for almost all the species. Hence, for further analysis for plotting trends, data from year 2002 onwards was considered.
How the Birds are Dispersed Across the Preserve & the Location of the Alleged Dumping Site

Looking At the Distribution & Movement of All Birds Species Across the Preserve
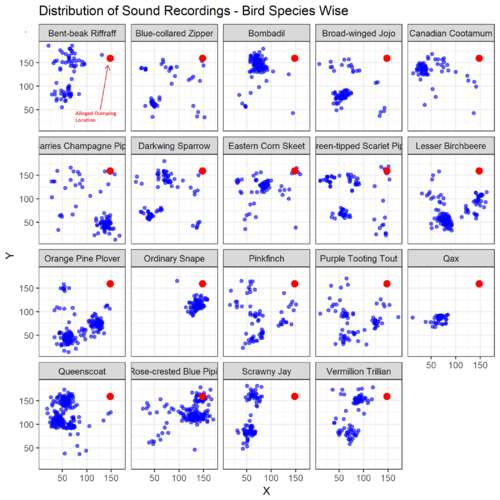
Below figure shows the distribution of bird sound recordings across the preserve for each species:
As can be observed, few of the bird species have never been spotted or recorded near the alleged dumping location such as “Qax”, “Pinkfinch”, and “Bent-beak Riffraff”. Although, bulk of the “Rose-crested Blue Pipit” clusters have been spotted at the dumping location or in region nearby the dumping location, this does not give a conclusive indication about the situation of the Pipit. Since, from the overall time trend it can noticed that the species which have not been spotted near the dumping location show an overall decreasing trend since 2013.
Interestingly, bird species “Carries Champagne Pipit” & “Green tipped Scarlet Pipit” show an increasing trend since 2015 despite being spotted near the dumping location.
A Closer Look At Rose-crested Blue Pipit
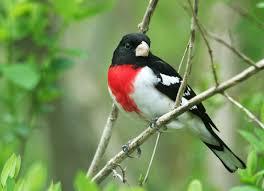
Now, let’s take a closer look at the species that we are interested in – “Red-crested Blue Pipit”
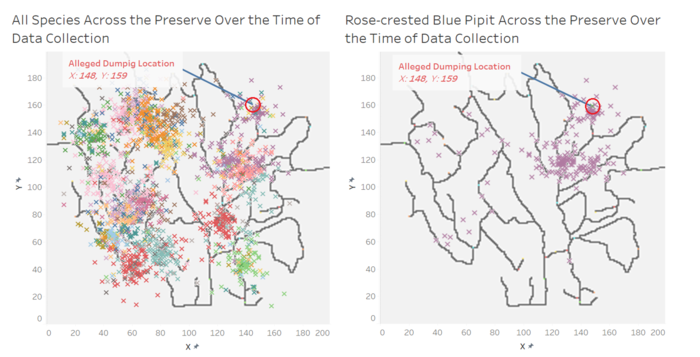
The distribution of the Pipit over the time of data collection i.e. from 1991 to 2018 is shown below:
<<figure>>
However, as stated earlier, we would be considering only 2002 & above data for analysis. The trend for number of recordings through these years and overall movement of the birds across the preserve is shown in graphs below:
<<figure>>


