ISSS608 2017-18 T3 Assign Akanksha Shrirang Yadav eda
|
|
|
|
|
|
|
To answer question 1 of the challenge, following visualizations were built using Tableau as well as R.
A View of The Overall Trend Across Years
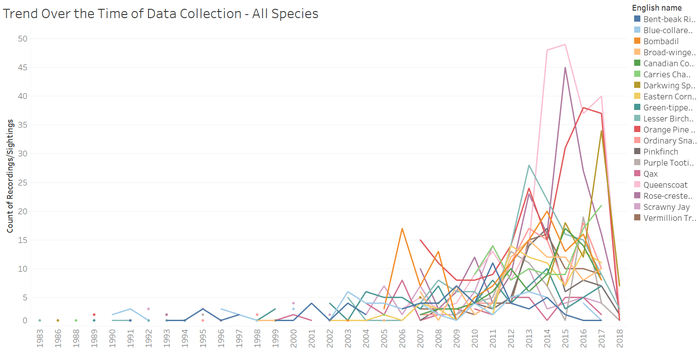
Number of Sound Recordings Plotted Against Years – Bird Species Wise
To begin with, the count of recordings (as per species) over the duration of data collection was plotted against the duration of collection to understand the trend through years. It could be noticed that for initial years there aren’t enough data points for almost all the species. Hence, for further analysis for plotting trends, data from year 2002 onwards was considered.
How the Birds are Dispersed Across the Preserve & the Location of the Alleged Dumping Site
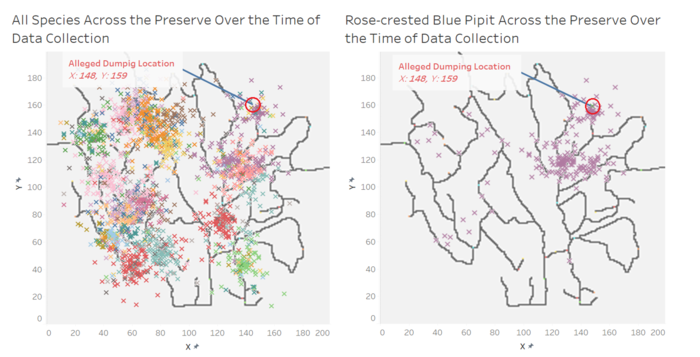
Looking at the visualizations above, it can be perceived that "Rose-crested Blue Pipits" might get most affected due to the alleged dumping site as highest number of pipits can be seen spotted or recorded in the nearby region as compared to any other bird species.
Looking At the Distribution & Movement of All Birds Species Across the Preserve
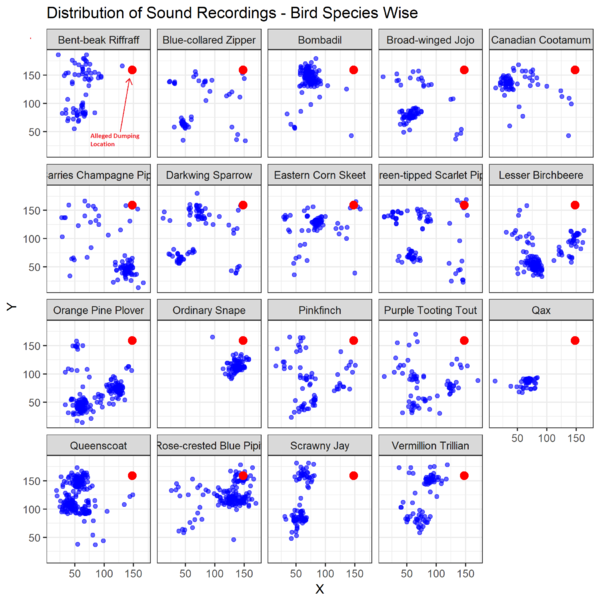
Below figure shows the distribution of bird sound recordings across the preserve for each species:
Please note that the red circle indicates the alleged dumping location in all figures below.
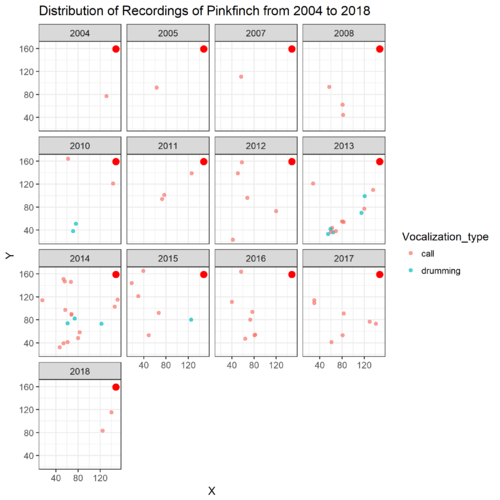
As can be observed, few of the bird species have never been spotted or recorded near the alleged dumping location such as “Qax”, “Pinkfinch”, and “Bent-beak Riffraff”. Although, bulk of the “Rose-crested Blue Pipit” clusters have been spotted at the dumping location or in region nearby the dumping location, this does not give a conclusive indication about the situation of the Pipit. Since, from the overall time trend it can noticed that the species which have not been spotted near the dumping location show an overall decreasing trend since 2013.
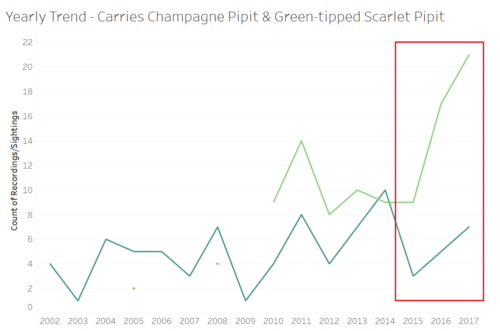
Interestingly, bird species “Carries Champagne Pipit” & “Green tipped Scarlet Pipit” show an increasing trend since 2015 despite being spotted near the dumping location.
A Closer Look At Rose-crested Blue Pipit
Now, let’s take a closer look at the species that we are interested in – “Red-crested Blue Pipit”
Yearly Pattern
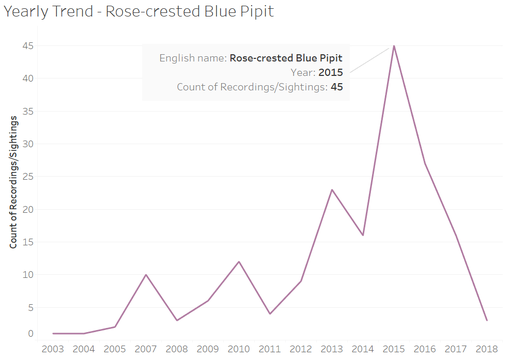
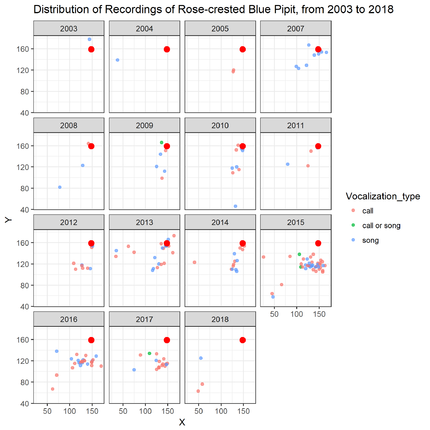
As stated earlier, we would be considering only 2002 & above data for analysis. The trend for number of recordings through these years and overall movement of the birds across the preserve is shown in graph below:
Overall time trend shows that the beloved pipit reached the peak of recordings/sightings during the year 2015, after which the call recordings dwindled sharply. From the distribution plot, they seem to have been recorded/observed at or near the dumping site from years 2007 to 2014, however the birds seem to be moving away from the dumping site gradually. Also noticeable is the moderate increase in bird calls rather than bird songs over the years. A call can be a sign of distress, a cry for help such as warning sound or sharp note to drive an enemy away or a begging plea. A bird song on the other hand might be an indication of a bird’s health & vibrancy.
Quarterly (Seasonal) & Monthly Patterns
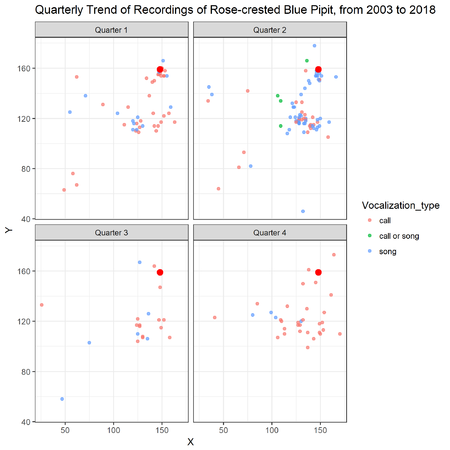
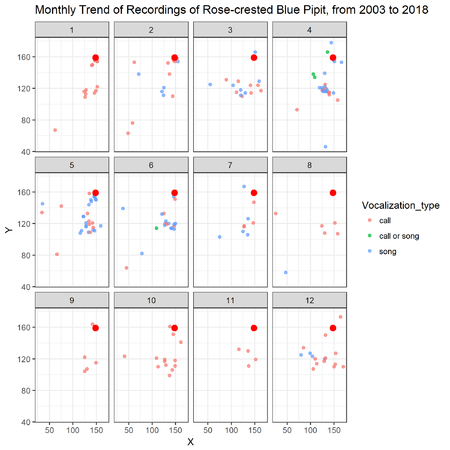
From the Quarterly plot, more birds seem to be returning back during the second quarter over the years with the more numbers showing up in the months of March, April & May. However, most of the birds tend to flock away in quarter 3. Also notice, how the bulk of the bird sounds are songs during these months as apposed to quarter 4, in which case there are more bird calls than songs.
What About Other Birds?
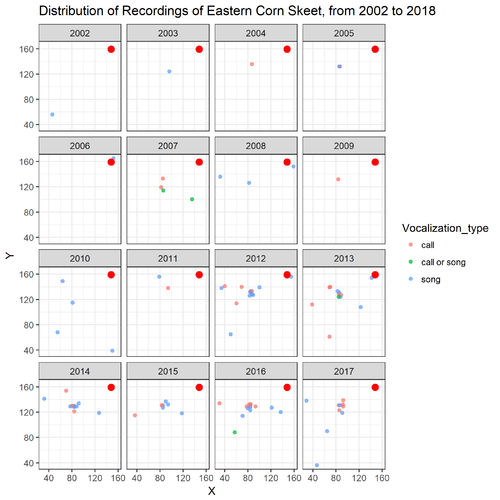
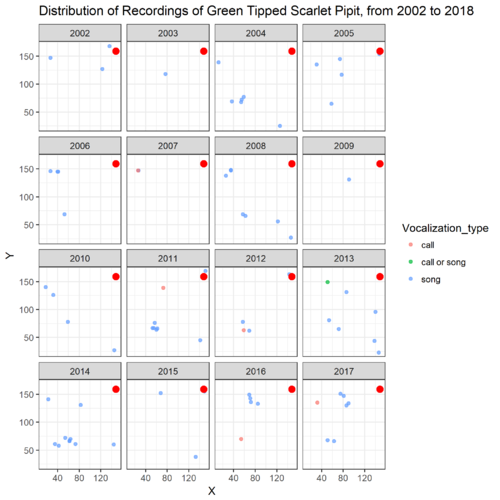
Let’s now look at if some of the other birds are exhibiting a similar behaviour, especially those spotted at or near the dumping location. The two varieties of birds spotted nearby the dumping location are “Eastern Corn Skeet” and “Green Tipped Scarlet Pipit”.
However, not a lot of birds being recorded near the dumping site for both the species. Their numbers are very small in comparison to “Red-crested Blue Pipit”. Another thing to observe is that the number of songs are more than calls for both the varieties.
Trend In The Last 3 Years
Most bird species seem to be showing a decreasing trend in the number of sound recordings, even if they have never been spotted near the alleged dumping location. There are some varieties of birds such as “Qax” & “Bombadil” seem to be exhibiting a constant cyclical pattern.
The Only Bird Species Showing Signs of Increasing Recordings/Sightings Since 2015
We have already looked at the movement of “Green Tipped Scarlet Pipit” across preserve. The overall trend across years shows an overall increasing trend while exhibiting cyclical pattern since 2007.
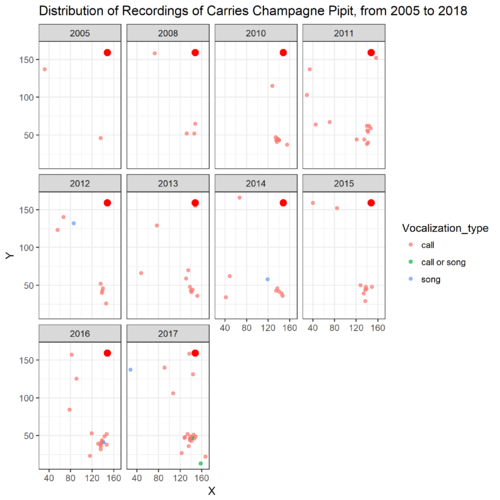
Below figure shows the distribution of “Carries Champagne Pipit”. This species exhibits an increasing trend from 2015. Another fascinating thing to notice is how these birds don’t seem to sing at all. All the communications recorded are bird calls, albeit only a couple of them have been spotted near the dumping site over all these years.
Is Bird Call Really An Indication Of Danger?
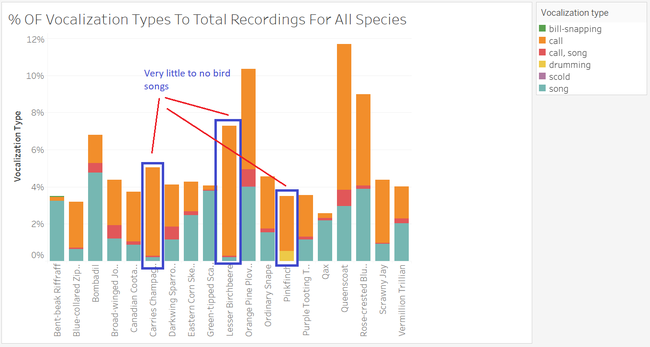
Well, let’s look at the % of bird calls to the total number of recordings over the years for all the birds.
There are a couple of varieties of birds such as “Lesser Birchbeere” and “Carries Champagne Pipit” (as seen above) which do not seem to sing frequently. Moreover, “Pinkfinch” don’t sing at all.
Hence, it can not be said conclusively that concrete inferences can be drawn only based on the trend in the number of bird calls alone. It might also indicate communication amongst birds at times.
