ISSS608 2017-18 T3 Assign Akanksha Shrirang Yadav dataprep
Jump to navigation
Jump to search
 VAST Mini Challenge 1: Are The Beloved Pipits Disappearing?
|
|
|
|
|
|
|
Data Description
The description of the provided dataset files is:
| Data | Details |
|---|---|
| ALL BIRDS.zip |
|
| AllBirdsv4.csv |
|
| Lekagul Roadways 2018 Map |
|
| Test Birds from Kasios |
|
| Test Bird Location |
|
Approach In A Nutshell
- After initial exploration of the dataset in SAS JMP, few data inconstancies and data coding issues were discovered. The steps taken to clean the dataset are covered in ‘Data Cleaning’ section.
- Tableau was used to perform further exploration on the cleaned dataset. Basic visualizations were built in Tableau which revealed few trends & patterns for the species of the birds.
- Geospatial as well as distribution analysis was performed in R using the bird call collection data & the provided Lekagul Roadways map to uncover the trends of all the known bird species across the Preserve. This analysis constituted exploring how birds move from the ‘Alleged Dumping Location of Kasios’ (X=148 & Y=159 on the map).
- Next, audio analysis was performed on the provided 2081 sound files in R to extract features of an audio. Relevant featrues were selected from the set of extracted features. These selected features were used to build visualizations of bird species according to their sound waves. The test bird sound files were compared against these visualizations in an attempt to uncover the truth behind Kasios’ claim about Rose-crested Blue Pipit species.
- Based on the analysis done so far, insights were drawn concerning the state of Rose-crested Blue Pipit.
Tools Used
- Primary Tool Used for Creating Visualizations & Performing Analysis -> R
- Initial Exploration & Data Cleaning -> SAS JMP
- Basic Plot Creation -> Tableau
R Packages Used:
- ggplot2
- sp
- dplyr
- tidyverse
- spatstat
- readbitmap
- raster
- grid
- imager
- pixmap
- stringr
- soundgen
- seewave
- tuneR
- corrplot
- ClustOfVar
- cluster
Data Cleaning
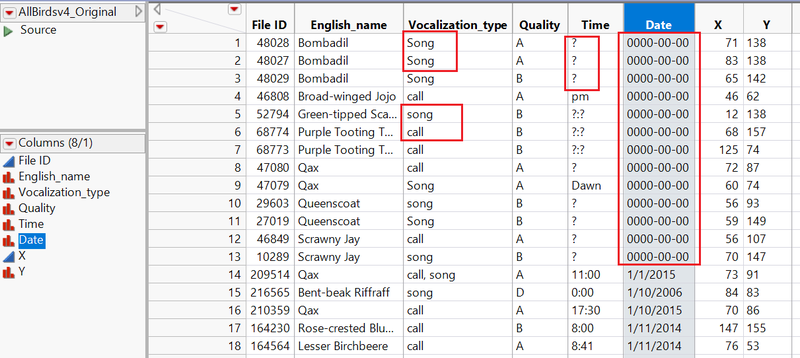
- The ‘AllBirdsv4.csv’ contains 8 variables as explained above. Columns ‘Vocalization_type’, ‘Date’ & ‘Time’ were found to have inconsistent coding. Additionally, ‘Date’ field was found to be ‘Nominal’ & containing invalid values such as ‘0000-00-00’ or ‘2012-12-00’ etc.

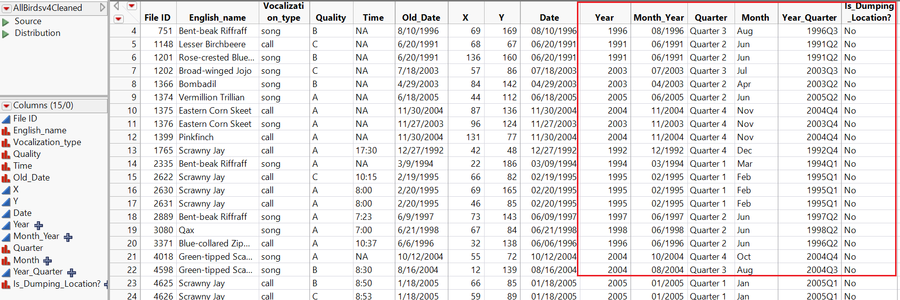
- The modeling type of ‘Date’ field was updated from ‘Nominal’ to ‘Continuous’. The date format was made consistent to ‘mm/dd/yyyy’. All the dates missing the day value were imputed with 1st day of the month since the recordings will anyway be visualized at the granularity of year, quarter or month. ‘Time’ column was also cleaned to have ‘:’ instead of ‘.’ & ‘?’ replaced with ‘NA’.
- The values in ‘Vocalization_type’ were recoded to be small case & ‘?’ were replaced with ‘NA’.
- The modeling type of coordinate column ‘Y’ was changed to ‘Continuous’ from ‘Nominal’. 2 values in column Y contained ‘?’ which were removed during the cleaning.
- Finally, ‘Year’, ‘Quarter’ & ‘Month’ were extracted from the ‘Date’ column and added to the dataset. An additional column called ‘Is_Dumping_Location?’ was calculated indicating if the location where call was recorded is the alleged dumping site location or not.
- Cleaned and final dataset ->

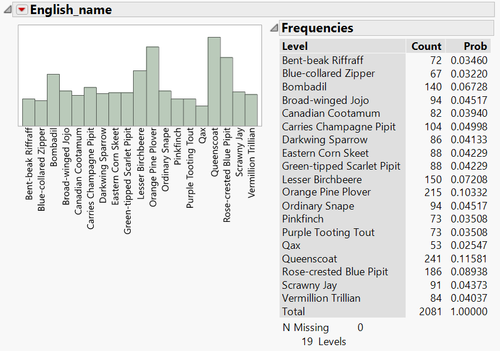
A Look At The Distributions
- Looking at the distributions, it can be seen that there are 19 species of birds. The species we were interested in "Rose-crested Blue Pipit" has 186 recordings over the time of data collection.
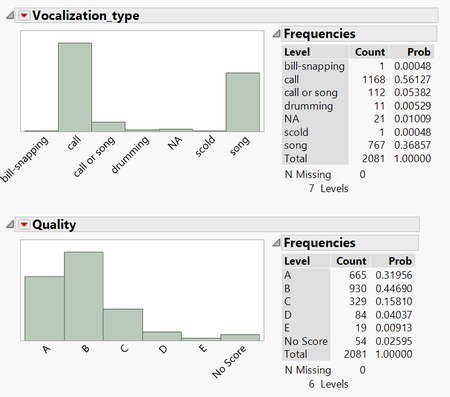
- There are more recordings for bird call than bird song.

