Difference between revisions of "ISSS608 2017 T3 Assign BI HE Question2"
He.bi.2017 (talk | contribs) |
He.bi.2017 (talk | contribs) |
||
| (One intermediate revision by the same user not shown) | |||
| Line 1: | Line 1: | ||
| − | + | <div style=background:##CCCCCC border:#A3BFB1> | |
| + | [[Image:Bhtitle.jpg.jpg|300px]] | ||
| + | <b><font size = 6; color="#FFFFFF"; style="font-family:Century Gothic"> ISSS608 2017-18 T3 Assign Bi He MC2</font></b> | ||
| + | </div> | ||
__NOTOC__ | __NOTOC__ | ||
| Line 42: | Line 45: | ||
<tr> | <tr> | ||
<td> | <td> | ||
| − | [[File: | + | [[File:Bh31.png|300 px|left]]</td> |
</tr> | </tr> | ||
Latest revision as of 12:13, 10 July 2018
|
|
|
|
|
|
Q2 What anomalies do you find in the waterway samples dataset? How do these affect your analysis of potential problems to the environment? Is the Hydrology Department collecting sufficient data to understand the comprehensive situation across the Preserve? What changes would you propose to make in the sampling approach to best understand the situation?
Anomalies for waterway samples data
* Redundant data
The original dataset has more than one records for the same location in the same time, which are redundant, and may make noise in further research.
* Missing data
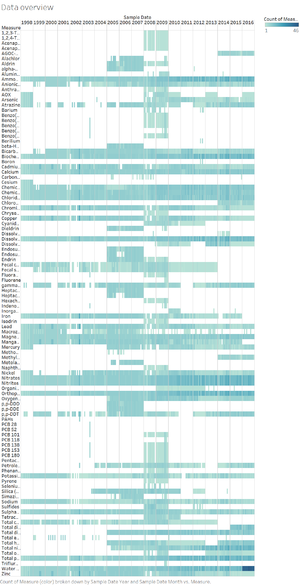
Using the heat maps with count of records number as marks show an overview for the whole dataset. The data for many chemistry indicators are not continues and incomplete. it is impossible to find the correlation between chemistry indicators and find the pattern.
* Incorrect data (abnormal value)
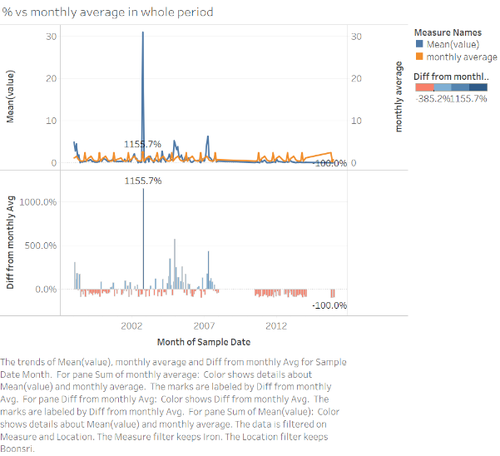
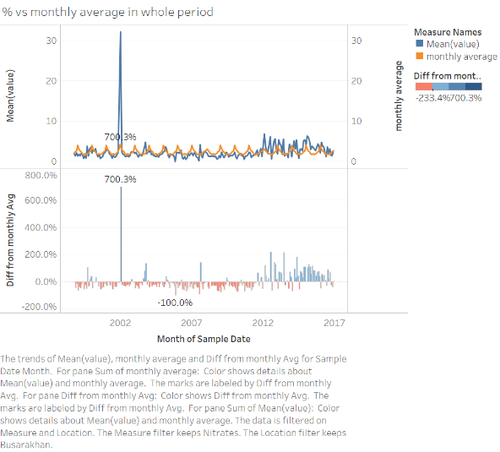
some values such as the data for iron in 2002 and 2003, and nitrates in some place are extremely high, and it is suspected to be incorrect.
Hydrology Department is not collecting sufficient data to understand the comprehensive situation across the Preserve. I propose that Hydrology Department set up automatic sensors in each observation spot and get the regular and precise data for data analysts.


