Difference between revisions of "ISSS608 2017-18 T3 Assign Xie Zhimao Findings"
Jump to navigation
Jump to search
| Line 26: | Line 26: | ||
</div> | </div> | ||
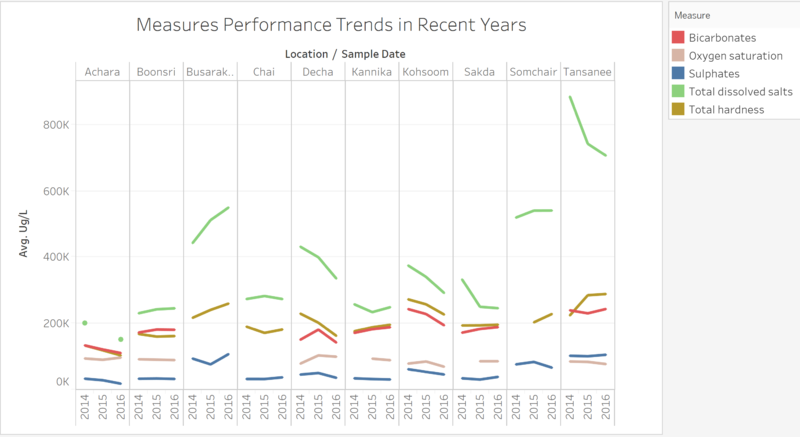
From previously graphs we pick out 10 representive measures in recent three years and visualiza the their trends.<br> | From previously graphs we pick out 10 representive measures in recent three years and visualiza the their trends.<br> | ||
| − | 10 measures are as follow: Total dissolved salts, Total hardness, Bicarbonates, Oxygen Saturation, Sulphates, Methylosmoline, Chromiunm, Calcium, Sodium, Magnesium.<br> | + | 10 measures are as follow: Total dissolved salts, Total hardness, Bicarbonates, Oxygen Saturation, Sulphates, Methylosmoline, Chromiunm, Calcium, Sodium, Magnesium. |
| + | |||
| + | <br> | ||
| + | [[File:Zhimao10.png|800px|center]] | ||
| + | <br> | ||
| + | #<b>Trends</b> | ||
| + | *In terms of volume of chemical contamination, most of measures keep in a relative stable interval. And for the total dissolved salts, it shows a downward trend overrallly. | ||
| + | *From the location pespectives, meansures average value in most regions have been effectively controlled and there is a trend of decreasing. However in Somchair and Busarakhan, the chemical cantamination is still slowly improving. | ||
| + | |||
| + | <br> | ||
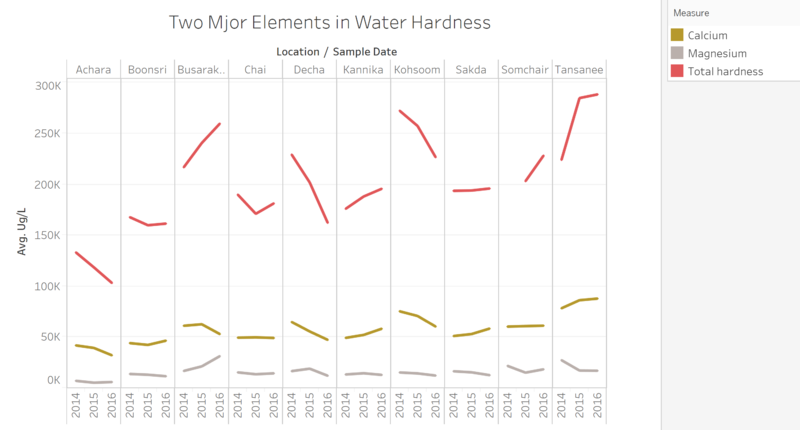
| + | [[File:Zhimao11.png|800px|center]] | ||
| + | <br> | ||
| + | *When if refers to the definition of Total Hardness, we could figure out that Hardness is caused by compounds of calcium and magnesium, and by a variety of other metals. So, we also extract those two elements value into consideration. | ||
| + | *Basically, the performance of two elements is accord with our expectations. Their comprehensive trends almost coorespond to Total Hardness in every locations. Namely, we condlude that we can just pay attention to the large value measures, since the Trace element trends and changes are included. | ||
Revision as of 09:32, 8 July 2018
 2018 Mini-Challenge 2 Visualization
|
|
|
|
|
Initial Findings
From previously graphs we pick out 10 representive measures in recent three years and visualiza the their trends.
10 measures are as follow: Total dissolved salts, Total hardness, Bicarbonates, Oxygen Saturation, Sulphates, Methylosmoline, Chromiunm, Calcium, Sodium, Magnesium.

- Trends
- In terms of volume of chemical contamination, most of measures keep in a relative stable interval. And for the total dissolved salts, it shows a downward trend overrallly.
- From the location pespectives, meansures average value in most regions have been effectively controlled and there is a trend of decreasing. However in Somchair and Busarakhan, the chemical cantamination is still slowly improving.

- When if refers to the definition of Total Hardness, we could figure out that Hardness is caused by compounds of calcium and magnesium, and by a variety of other metals. So, we also extract those two elements value into consideration.
- Basically, the performance of two elements is accord with our expectations. Their comprehensive trends almost coorespond to Total Hardness in every locations. Namely, we condlude that we can just pay attention to the large value measures, since the Trace element trends and changes are included.