ISSS608 2017-18 T3 Assign Tong Wen Liang Samuel Data Preparation

From Visual Analytics and Applications
Jump to navigation Jump to search

Blue Pipit.png VAST Challenge 2018: "Cheep" Shots?

Background

Methodology

Insights

Conclusion

Link to Dropbox


Methodology

Our Approach

To Examine Blue Pipit Spatial Distribution Prior to and After Alleged Dumping

Description Illustration
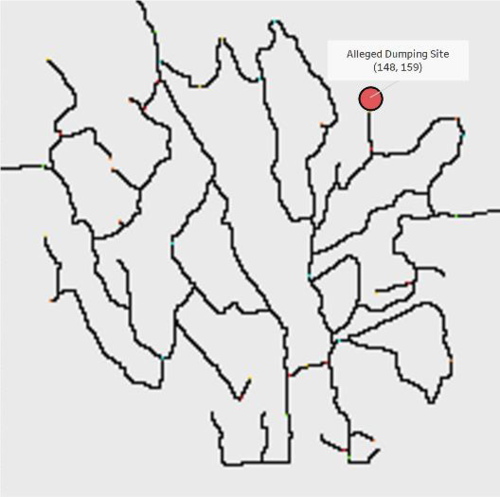
1. Alleged Dumping Site


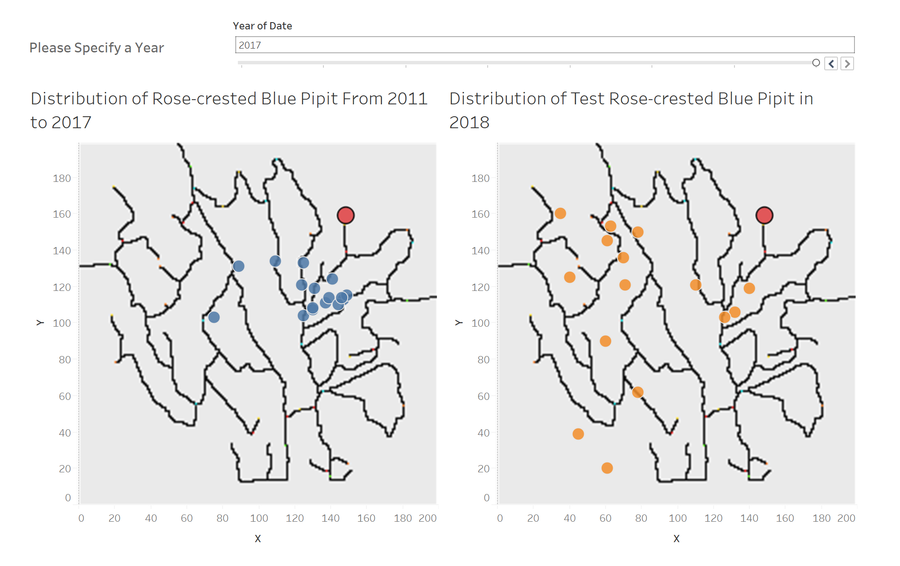
The location of the alleged dumping site was indicated as (148, 159). By marking the location on the map, it allows us to identify the spatial-temporal patterns of the affected Rose-Crested Blue Pipits in the Preserve prior to and after the alleged dumping of the process waste.

The Alleged Dumping Site.png
2. Time Period (Years) and Alleged Date of Dumping

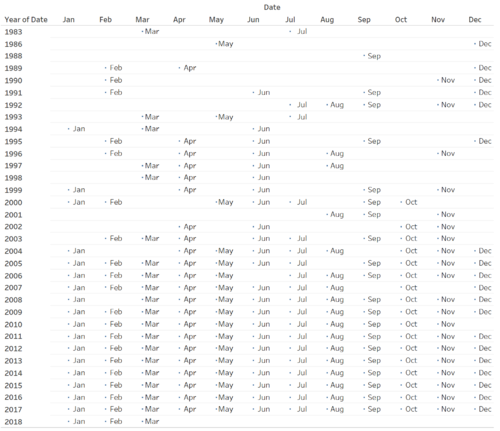
The number of months taken to record the vocalization of the birds in the Preserves over the years were not consistent. Only some years have recordings for all months – Year 2009 and 2011 to 2017.


Additionally, in accordance with the details obtained from VAST Challenged 2017, the alleged date of the chemical dumping was on 15th February 2015 as indicated in the orange arrow below:

1.2 Alleged Date of Dumping.png


Therefore, in order to facilitate in our analysis of the spatial-temporal patterns of the birds in the Preserve, we will use only year 2011 to 2017 for our data visualization of the distribution of birds prior to the dumping and after the dumping.

Time Period of Bird Vocalizations Recorded.png
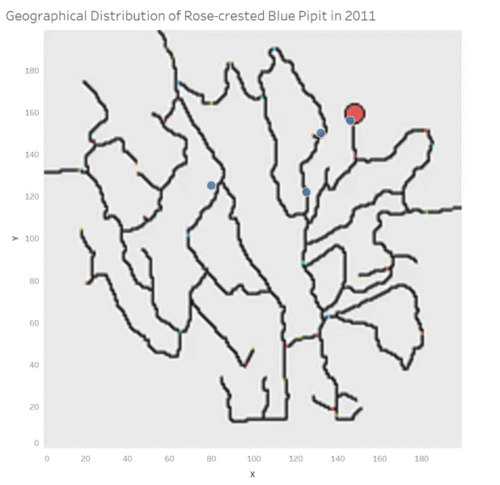
3. Geographical Distribution of Rose-crested Blue Pipit from 2011 to 2017

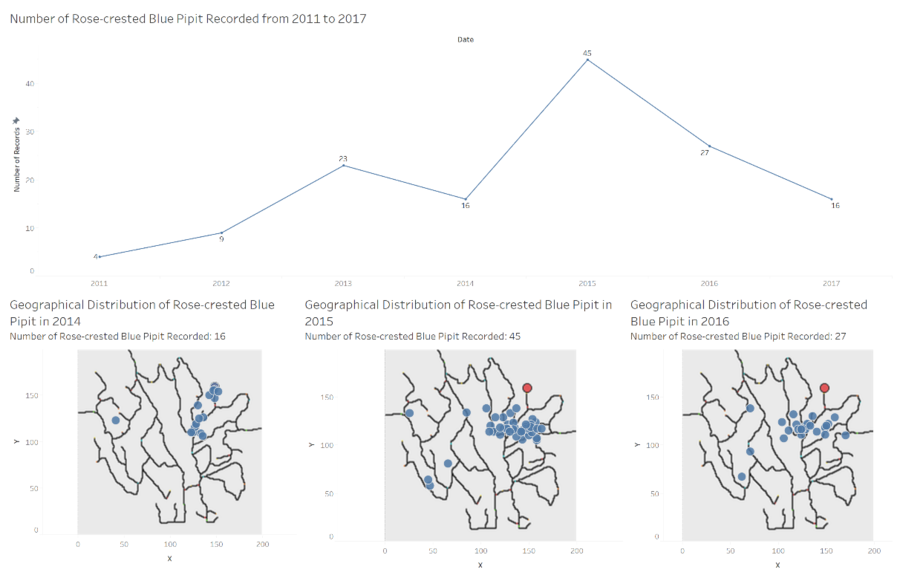
From 2011 to 2017, we want to identify the spatial distribution of the Rose-Crested Blue Pipits by plotting the location of where the recordings were taken over time.

1.3. Geog Dist of Blue Pipits from 2011 to 2017.gif
4. Number of Rose-Crested Blue Pipit Recorded from 2011 to 2017


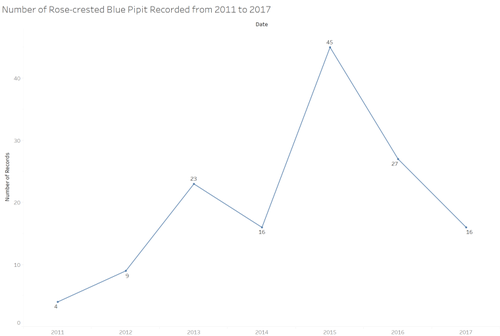
The number of Rose-crested Blue Pipit recorded peaked at 45 in 2015, just when the dumping took place. Thereafter, the number of Rose-crested Blue Pipit recorded dropped to 27 in 2016 and to 16 in 2017.

1.4. Number of Rose-Crested Blue Pipit Recorded from 2011 to 2017.png


To identify distribution of Blue Pipits by Vocalization Type from 2013 to 2015

Description Illustration
1. Vocalization Type


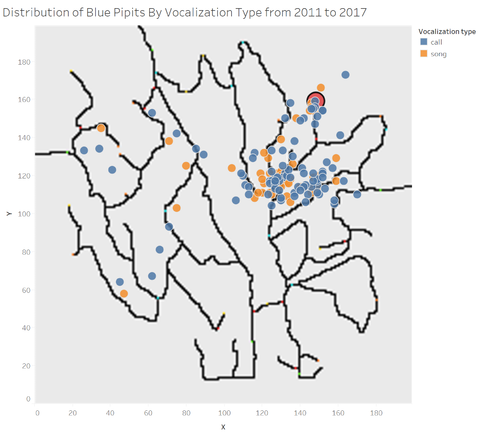
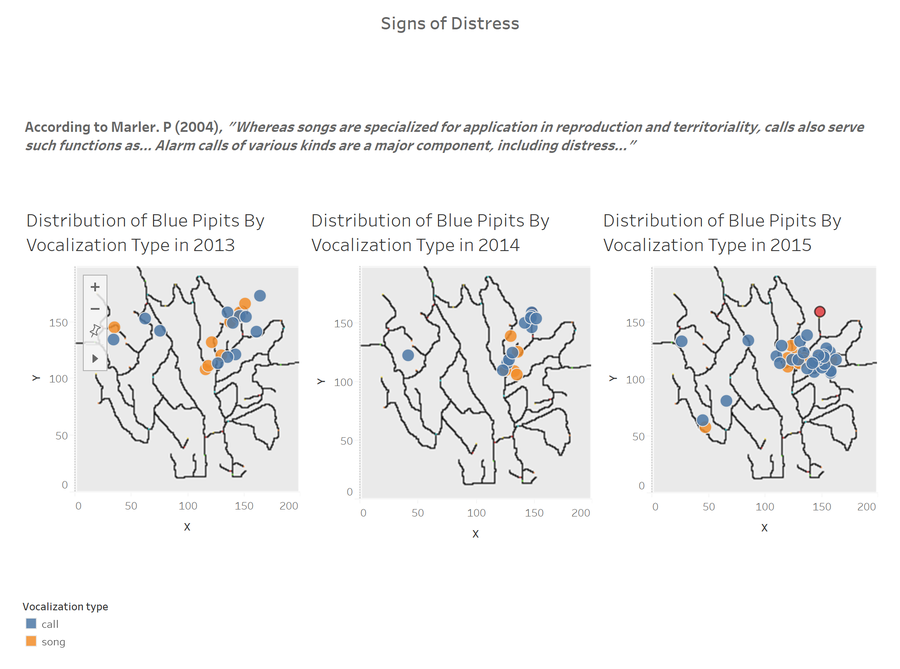
With multiple types of vocalizations, we want to focus mainly on the two major categories of vocalization, which is produced by the vocal organ of the birds – Call and Song.

Additionally, we will also exclude the Vocalization Type “call, song”, as we want to be specific about which vocalization type we are analysing.

2.1 Vocal type.png
2. Distribution of Blue Pipits by Vocalization Type from 2011 to 2017


We want to plot the distribution of Blue Pipits by Vocalization Types “Call” and “Song” from 2011 to 2017 to examine if there are any significant spatial pattern relating to the alleged process waste dump in 2015.

2.2. Distribution of Blue Pipits by Vocal Type from 2011 to 2017.png


To Compare Spatial Distribution Between Blue Pipits and Other Birds

Description Illustration
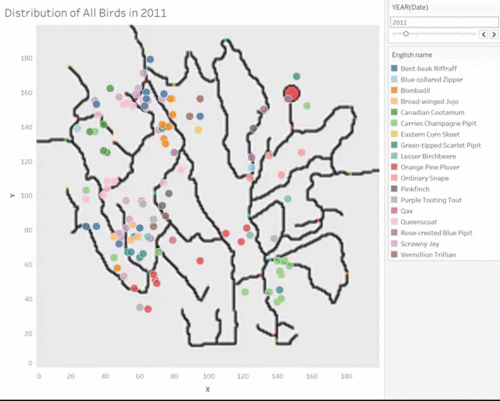
1. Geographical Distribution of All Birds from 2011 to 2017


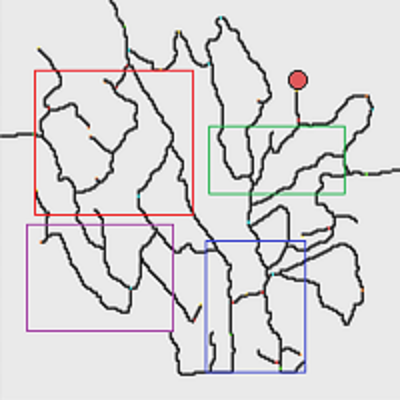
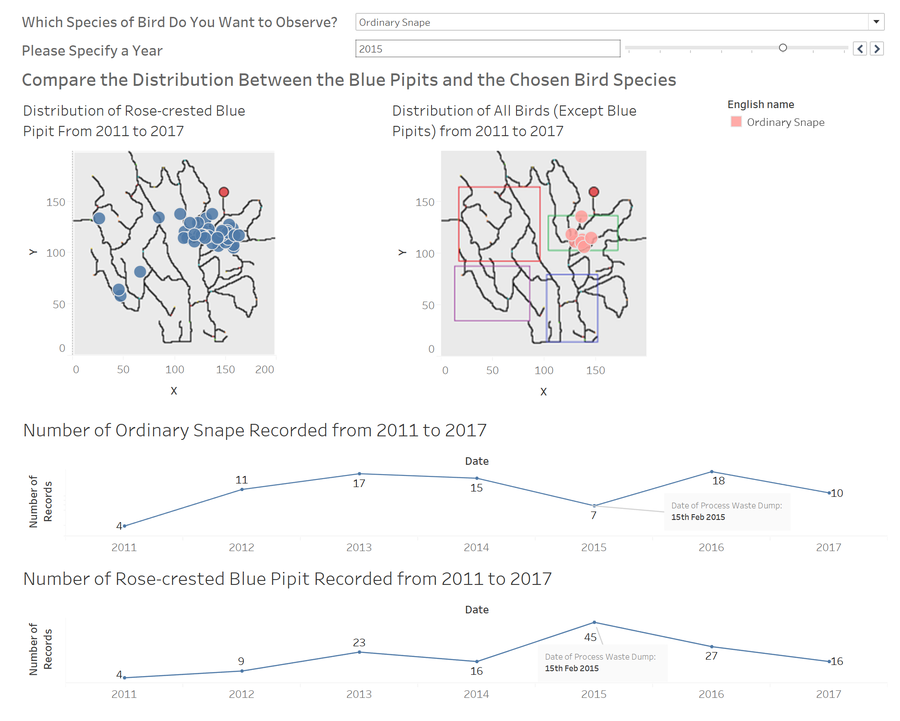
From 2011 to 2017, we can see that there are typically four major nesting areas for all birds – North-East, represented by the Green rectangle, North-West, represented by the Red rectangle, South-West, represented by the Purple rectangle, and South-East, represented by the Blue rectangle.

We want to map out the nesting areas for the other birds to be compared against the nesting area for the Blue Pipits to identify any possible spatial relationship between them.


Spatial Distribution of All Birds from 2011 to 2017

3.1 Distribution of all birds 2011-2017.gif


Four Major Nesting Areas

3.1 4 areas of geog distribution.png
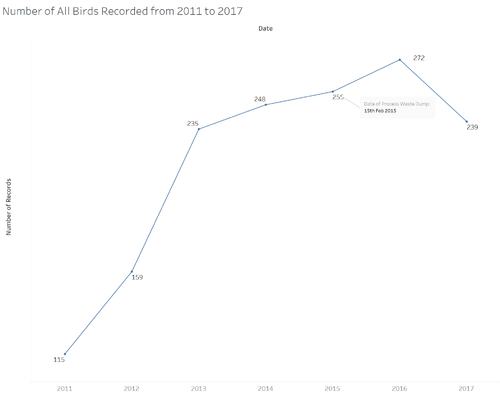
2. Number of All Birds Recorded from 2011 to 2017


Besides understanding the spatial distribution of all birds as compared to the spatial distribution of the Blue Pipits, we also want to know the population size of the birds in comparison with the population size of Blue Pipits for the chosen year of observation.

3.2 No. of all bird recroded from 2011 to 2017.png


To Compare Test Blue Pipits Locations Against Actual Blue Pipits Locations

Description Illustration
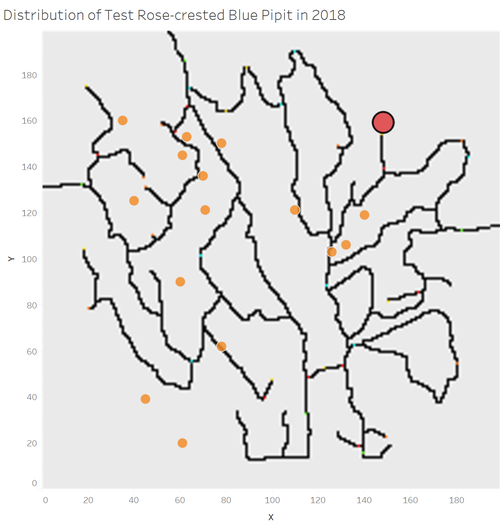
1. Distribution of Rose-Crested Blue Pipits Recording Locations


In order to back up their claim that the Rose-crested Blue Pipits population has not reduced, Kasios has provided a set of Pipit bird calls, recently recorded across the Preserve, with locations of where they were recorded.

There are 15 test recordings in total, with the spatial distribution of where these recordings were allegedly plotted onto the graph to the right.

4.1 Dis of Blue Pipits Recording Locations.png


To Select Samples of Actual Recordings for Analysis

Description Illustration
1. Number of Records by Quality and Vocalisation Type


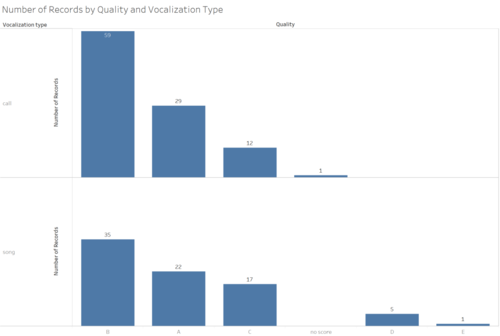
There are 51 recordings of Rose-crested Blue Pipits that are of grade A. 29 of them are calls, while 22 of them are songs.

To ensure that we will be able to accurately analyse the patterns of the actual recordings to be compared against that of the Test Recordings, it is essential that we only analyse recordings that are of Grade A.

5.1. No. of Records by Quality and Vocal Type.png
2. Distribution of Rose-crested Blue Pipits Grade A Song and Call Recordings


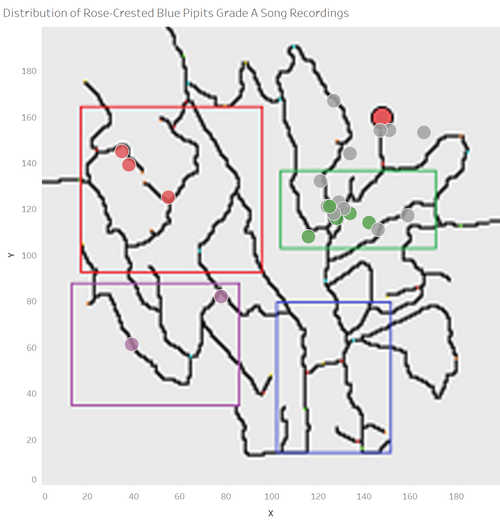
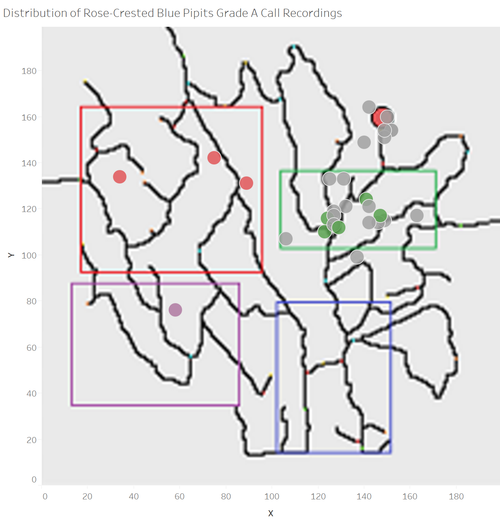
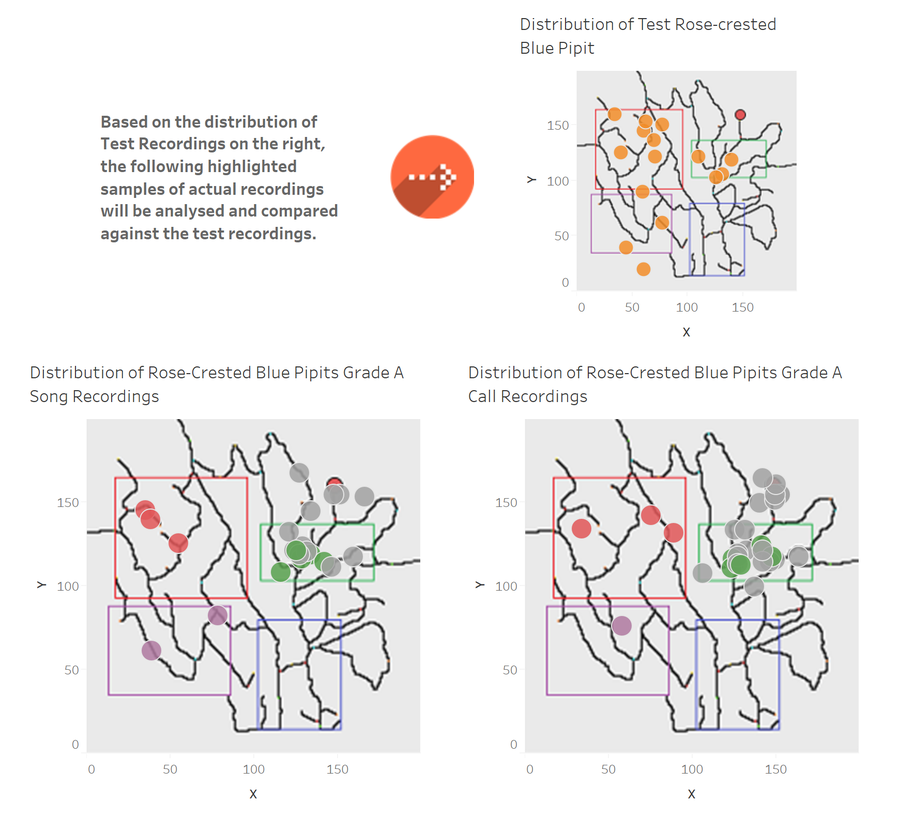
Upon plotting the distribution of the Grade A song and call actual recordings, we want to pick samples of actual recordings to be analysed and compared against the Test Recordings. This can be done by visualising where each of the Grade A recordings are located, and to pick those recordings that are located closest to the Test Recordings. Additionally, in order to ensure that we will be able to analyse if the sound waves of the test recordings are similar to the sound waves of the actual recordings, we want to take into account of possible environmental attributes that could lead to a difference in the patterns of recordings in each area. Therefore, we would like to first segregate the recordings into different areas as shown on the right.

Since the Test Recordings have no indication of vocalization type – Whether they are song or call vocalization, we will pick the maximum of 25% samples of the population in each coloured zones, or the total population in each coloured zones if the population is less than or equals to 5.

The selected actual recordings will thus be segregated into the following categories: 1. Green Song 2. Green Call 3. Red Song 4. Red Call 5. Purple Song 6. Purple Call

The designated colours attached to each recording category corresponds with the coloured areas to the right.

5.2. Dist of Blue Pipit Grade A Song.png
5.2. Dist of Blue Pipit Grade A Call.png


To Determine Authenticity of Test Recordings: Analyse Patterns Between Test Recordings and Actual Recordings

Description Illustration
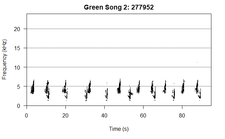
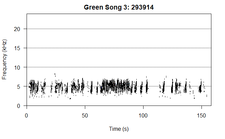
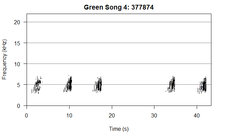
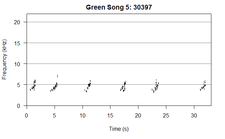
1. Samples of Actual Song and Call Recordings


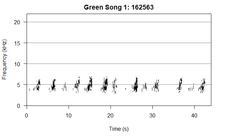
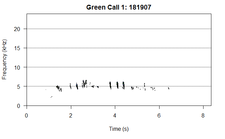
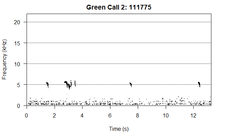
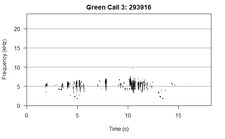
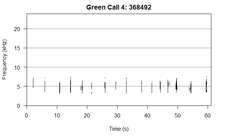
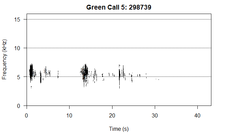
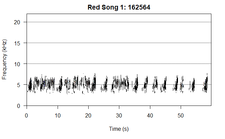
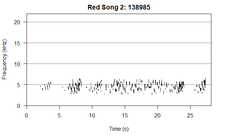
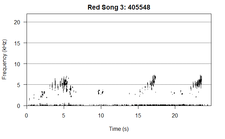
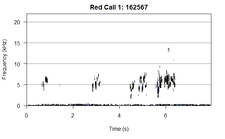
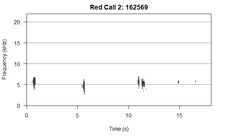
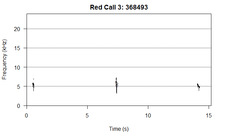
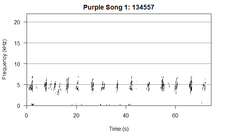
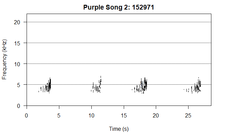
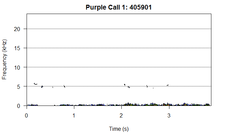
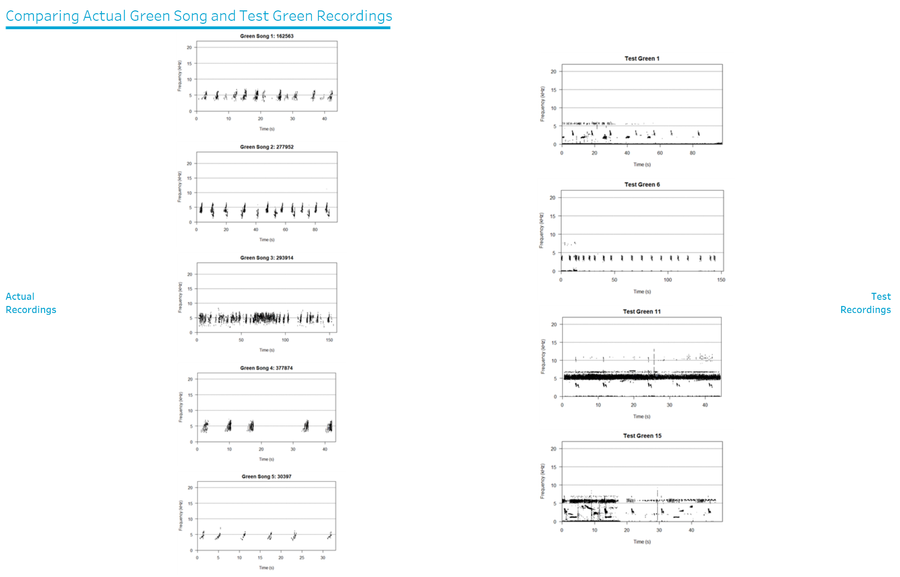
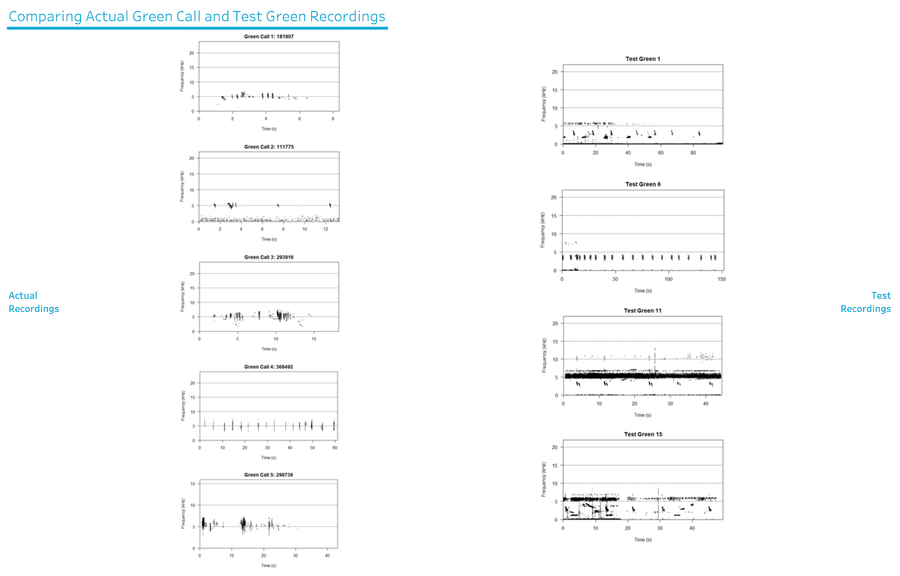
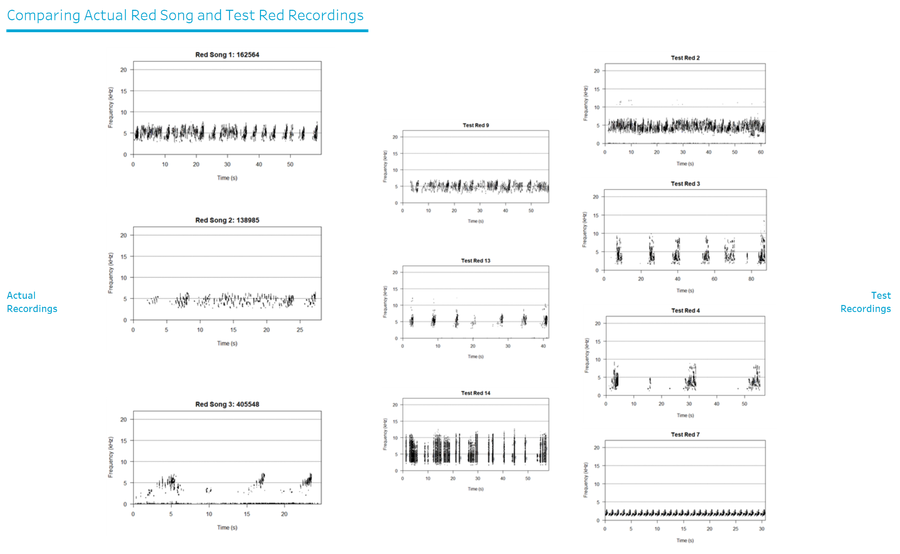
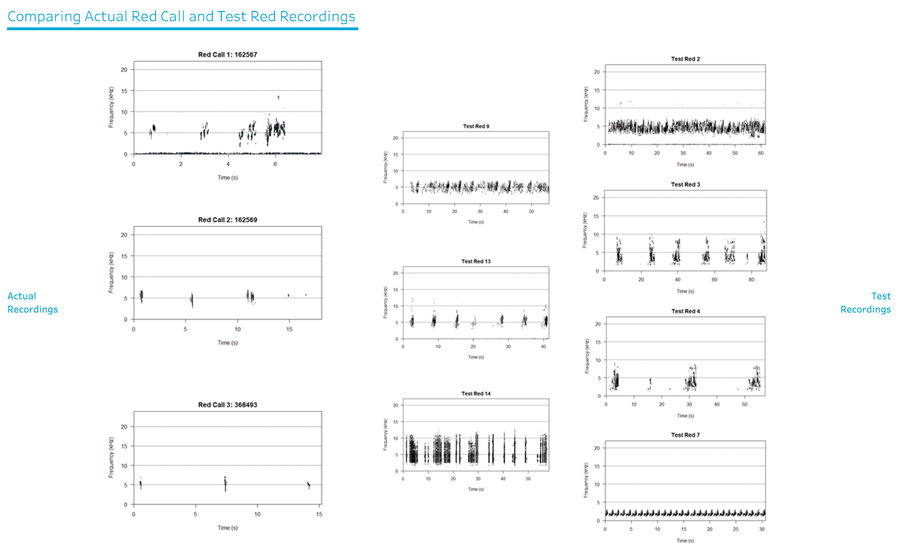
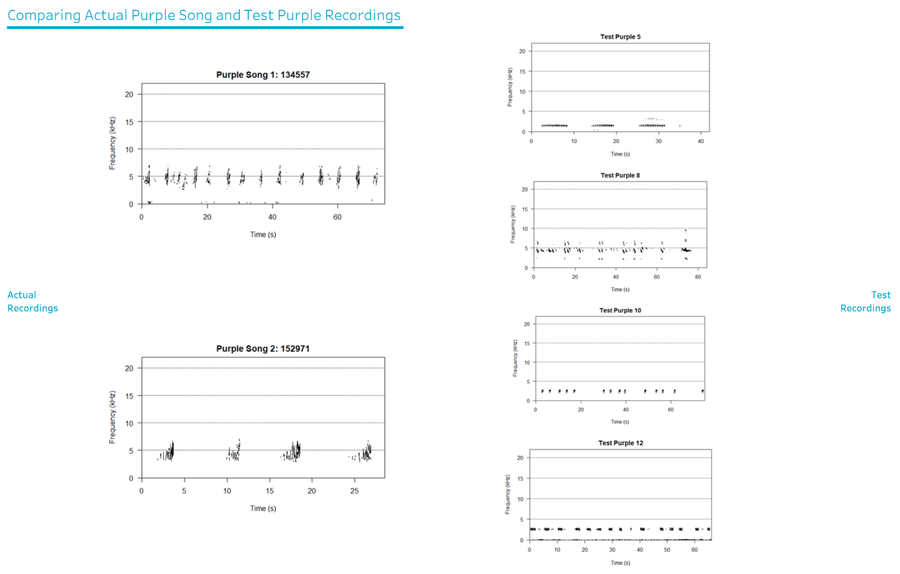
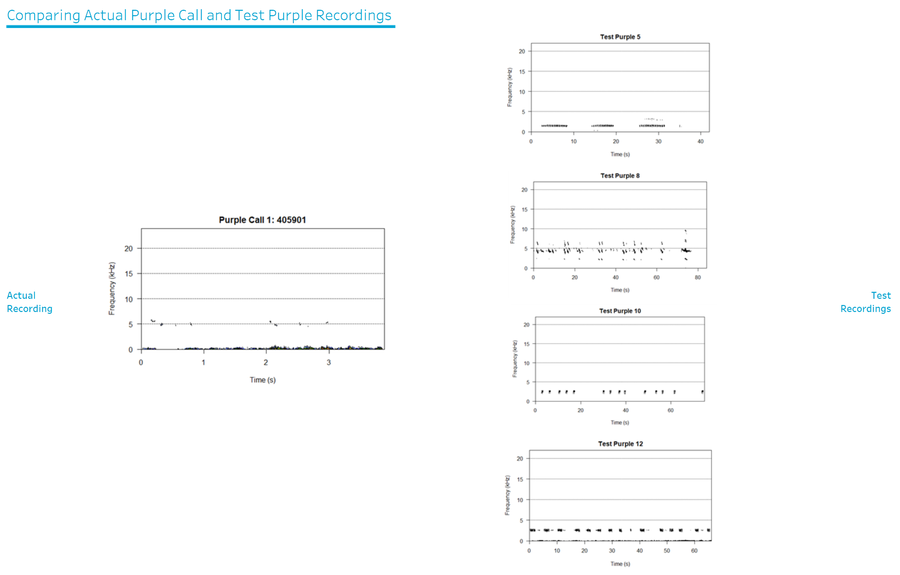
Upon selecting our samples of actual recordings, we will attempt to visualise these audio files by utilising the ‘tuneR’ package in R.


Green Song
Green Song 1.png Green Song 2.png Green Song 3.png Green Song 4.png Green Song 5.png
Green Call
Green Call 1.png Green Call 2.png Green Call 3.png Green Call 4.png Green Call 5.png
Red Song
Red Song 1.png Red Song 2.png Red Song 3.png
Red Call
Red Call 1.png Red Call 2.png Red Call 3.png
Purple Song
Purple Song 1.png Purple Song 2.png
Purple Call
Purple Call 1.png

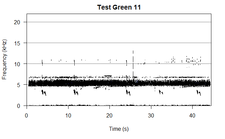
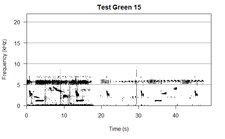
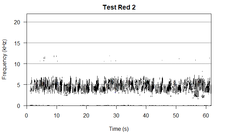
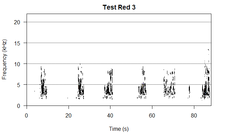
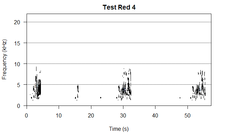
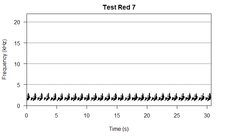
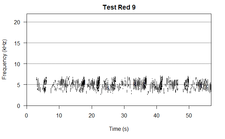
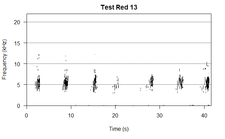
2. Samples of Test Recordings


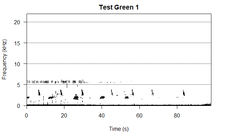
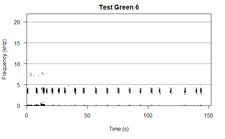
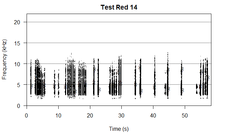
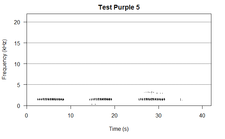
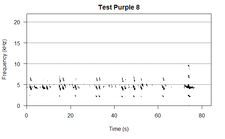
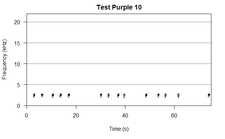
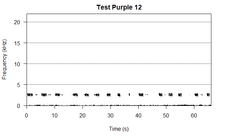
Additionally, we will visualise all Test Recordings, to be compared with the selected samples of actual grade A song and call recordings in each segment


Green Test Recordings
Test Green 1.png Test Green 6.png Test Green 11.png Test Green 15.png
Red Test Recordings
Test Red 2.png Test Red 3.png Test Red 4.png Test Red 7.png Test Red 9.png Test Red 13.png Test Red 14.png
Purple Test Recordings
Test Purple 5.png Test Purple 8.png Test Purple 10.png Test Purple 12.png

Dashboard Design

View the interactive Tableau design here: Link to tableau dashboard


1.Blue Pipit Spatial Distribution Prior and After Alleged Dumping

Dashboard - 1.png

2.Distribution of Blue Pipits by Vocalization Type from 2013 to 2015

Dashboard - 2.png

3.Comparison of Spatial Distribution Between Blue Pipits and All Other Birds

Dashboard - 3.png

4.Comparison of Test Blue Pipits Locations Against Actual Blue Pipits Locations

Dashboard - 4.png

5. Selecting Samples of Actual Recordings for Analysis

Dashboard - 5.png

6. Determining Authenticity of Test Recordings: Analysing Patterns Between Test Recordings and Actual Recordings

Dashboard - 6.1.png


Dashboard - 6.2.png


Dashboard - 6.3.png


Dashboard - 6.4.png


Dashboard - 6.5.png


Dashboard - 6.6.png