ISSS608 2017-18 T3 Assign Tan Yong Ying Task 2 Insights
 VAST Challenge 2018: Suspense at the Wildlife Preserve
|
|
|
|
|
|
|
Turn your attention to the set of bird calls supplied by Kasios. Does this set support the claim of Pipits being found across the Preserve? A machine learning approach using the bird call library may help your investigation. What is the role of visualization in your analysis of the Kasios bird calls? Please limit your answer to 10 images and 1000 words.
- Step 1: Look at the heatmap summary of mean frequency spectra comparison and shortlist a few test files with low frequency offset against the Rose-crested Blue Pipit song files.
Based on the heatmap, we see test files 2, 11 and 14 have low frequency offsets against the Rose Pipit files, so we will compare their spectrograms with the Rose-Pipit files first.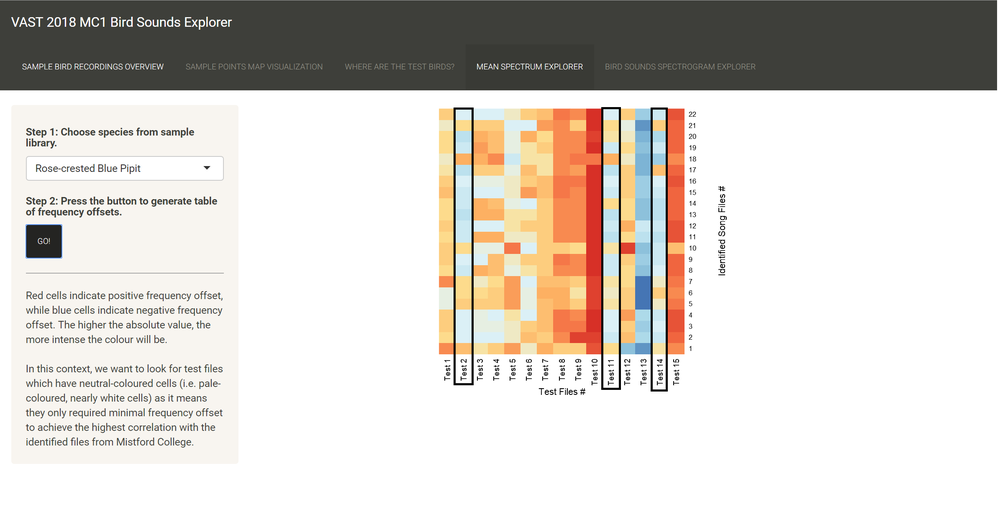
- Step 2: Compare the spectrograms of the shortlisted test files against the spectrograms of the known species.
After some comparison, we see that test file 2 is visually close to the Rose-crested Blue Pipit song.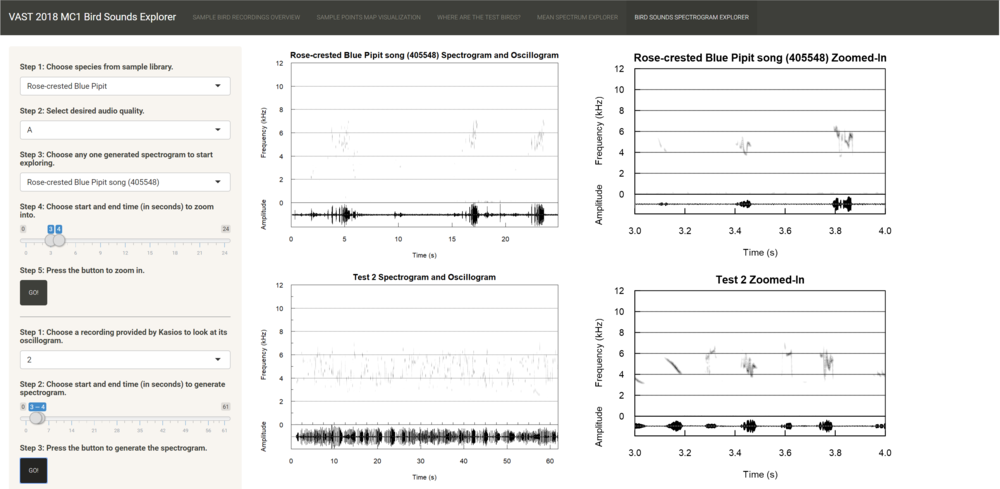
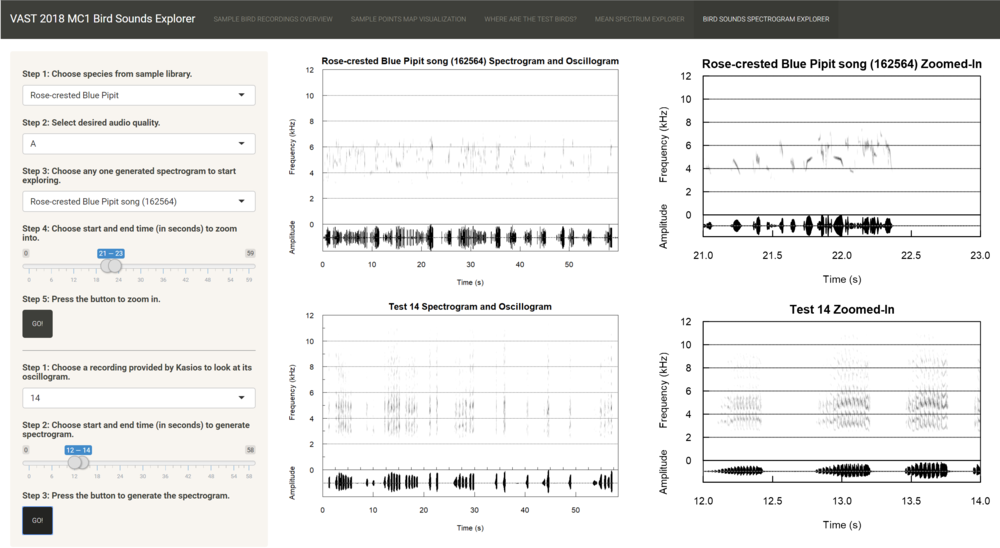
However, both test files 11 and 14 are visually not similar to the Rose-crested Blue Pipit. In fact, both files have different sonic textures, sound sequences and harmonics. This highlights the shortfall of analyzing sound files using purely statistical methods, which are usually unable to factor in the different shapes of bird sounds.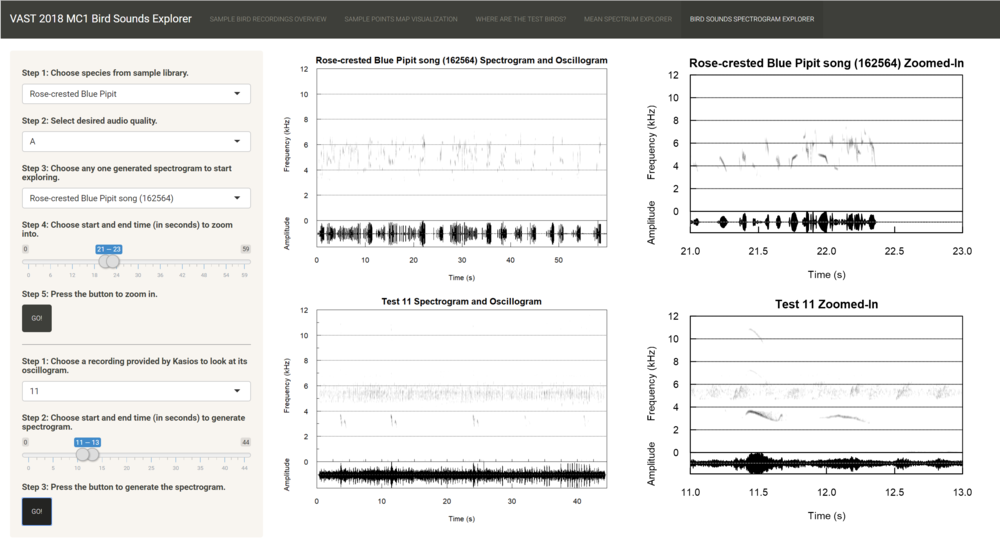
Also, upon further exploration, I noticed that test file 9 is very similar to the Rose Pipit song file too, but this does not show up in the heatmap. Therefore, this shows that a synthesis of multiple methods, both visual and statistical, and ideally lots of bird-sound identification experience is required to correctly identify bird sounds.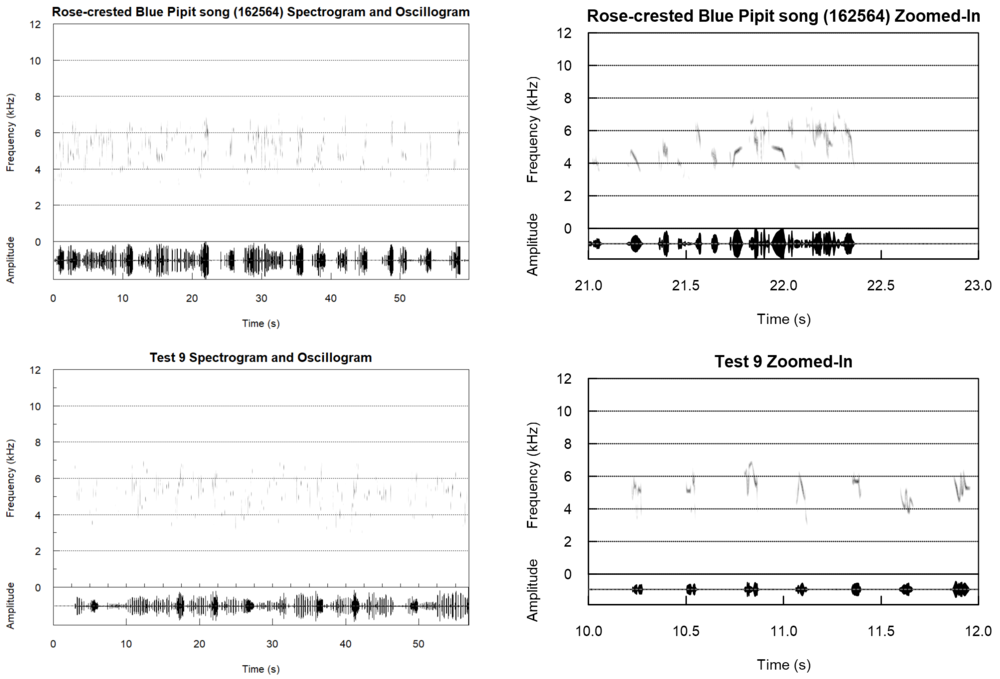
- Step 3: Refer to Where are the test birds? tab to compare where the suspected test files are recorded against the historical intensity of Rose-crested Blue Pipit.
In Step 2, we had shortlisted test files 2 and 9 to be the only files that are similar to the Rose-crested Blue Pipit. Looking at the map of the test points against the Rose-crested Blue Pipit concentrations, we see that these two files are not close to where the Pipits typically live at.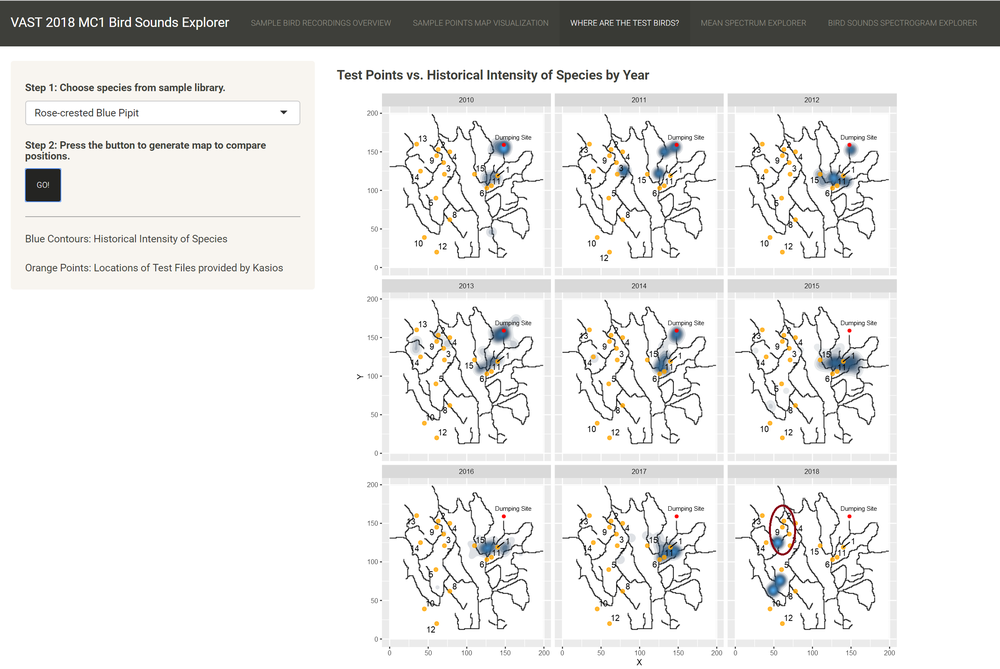


To summarize, in step 1 we identified that files 2, 11 and 14 may be Rose-crested Blue Pipits. In Step 2, we compared these test files to the Rose-crested Blue Pipit song spectrogram, but only file 2 is similarly close. In addition, we identified file 9 to be similar to Rose-crested Blue Pipit, although that was not observed in Step 1. In step 3, we looked at the locations of test files 2 and 9 and compared them against historical intensities of the Pipit over the years. Kasios claimed that the 15 files are evidence that the Rose-crested Blue Pipits are plentiful around the Preserve, and that they were recorded in the last few months. Looking at the map, we see that files 2 and 9 are not close to where the Pipits typically hang out. Overall, this set does not support the claim that Pipits are being found across the Preserve.
Banner image credit to: Marshal Hedin