ChenNannan-Insights
|
|
|
|
|
Chemical Contamination Analysis
Cycles
For dissolved oxygen, the value is highest in quarter 1 every year and lowest in quarter 2 every year. In quarter 3 the value increase slightly. For water temperature, the cycles are opposite to the dissolved. We can observe that the value of dissolved oxygen and water temperature have negative correlation. The dissolved oxygen is low when the water temperature is high.
Co-variation
These co-variation time_series data show similar pattern in the line graph. We can observe that the these 2 groups of measure have similar pattern and have positive correlation.
Exception
The Fecal coliforms and Fecal streptococci correlate with each other and reach to the peak in 2011 quarter 2 simultaneously. The reason of exceptions in 2011 quarter 2 need to study.
The graph show like a bowl in 2011 after a decrease trend since 2005 and following with one year no record. In the next time sample in 2014, the value is increase a lot.
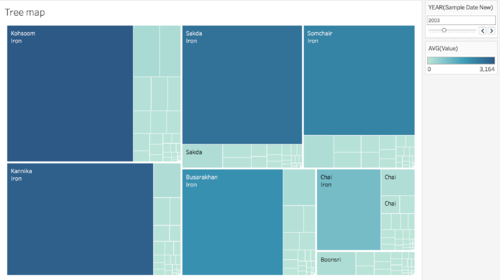
The value of iron reach to a extremely high value in 2013 in most of the location.
We can see from the tree map that even the iron is not the relatively high measure; it is extremely high in 2013.
After normalisation the value of iron is relative low. The outliers of iron value in 2013 is relatively high.
Sample Analysis
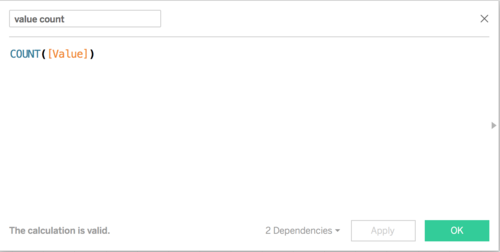
In order to study the pattern of the sample history, I create a calculation named value count which is aim to count the number of sample times.
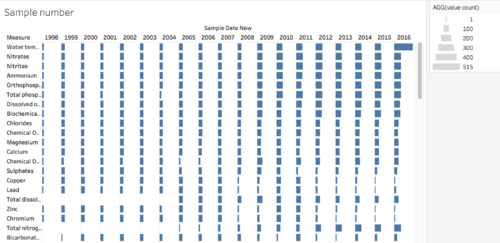
I take an initial look in the measure study among years, we can find that the number they sample the water temperature in 2016 is highest. For the measure like water temperature, Nitrates, Nitrites, Ammonium and so on, the trend of sample times is growing. The times of measure Copper, Zinc, Chromium and Lead decrease slightly in recent 5 years. And the measure of Total dissolved salt and Total nitrogen starts in 2005 and increase rapidly these years.
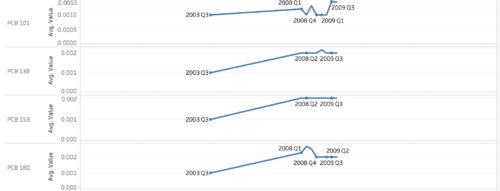
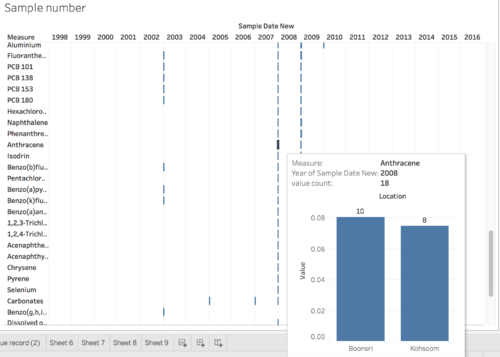
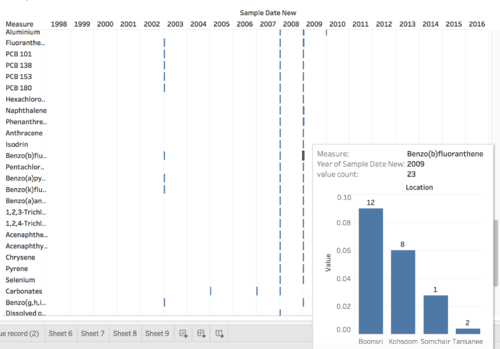
For several measures the sample years are only in 2008 and 2009.And for the measure only measured in 2008 and 2009, the two locations sample the measure are always be Boonsri and Kohsoom. Then in 2009, the number of location sample the measure can increase to more locations. It seems like a chemical sample for testing.

